

Bad Breadth & Bubbles
Bad Breadth & Bubbles
LHWM Market Quick View-May 2023

Key Take Away
On the surface, one might think things are going well in 2023, with the S&P 500 up about 10% year-to-date. However, a look under the hood reveals that most of the stock market continues to struggle. In fact, all the gains in the S&P 500 so far this year can be attributed to the performance of just seven companies. These seven companies (Apple, Microsoft, Alphabet, Nvidia, Meta, Amazon, and Tesla) are propping up the market. The breadth of participation in this stock market is extremely narrow. Broad participation across the stock market would be much more indicative of a healthy, confident market. Additionally, the handful of stocks leading the charge is fueled by A.I. FOMO (Fear of Missing Out), which has pushed the valuations of these stocks to extremes. To all those chasing these A.I. stocks right now…caveat emptor!
LHWM models remain defensive.
U.S. Outlook (Next 3-12 Months)
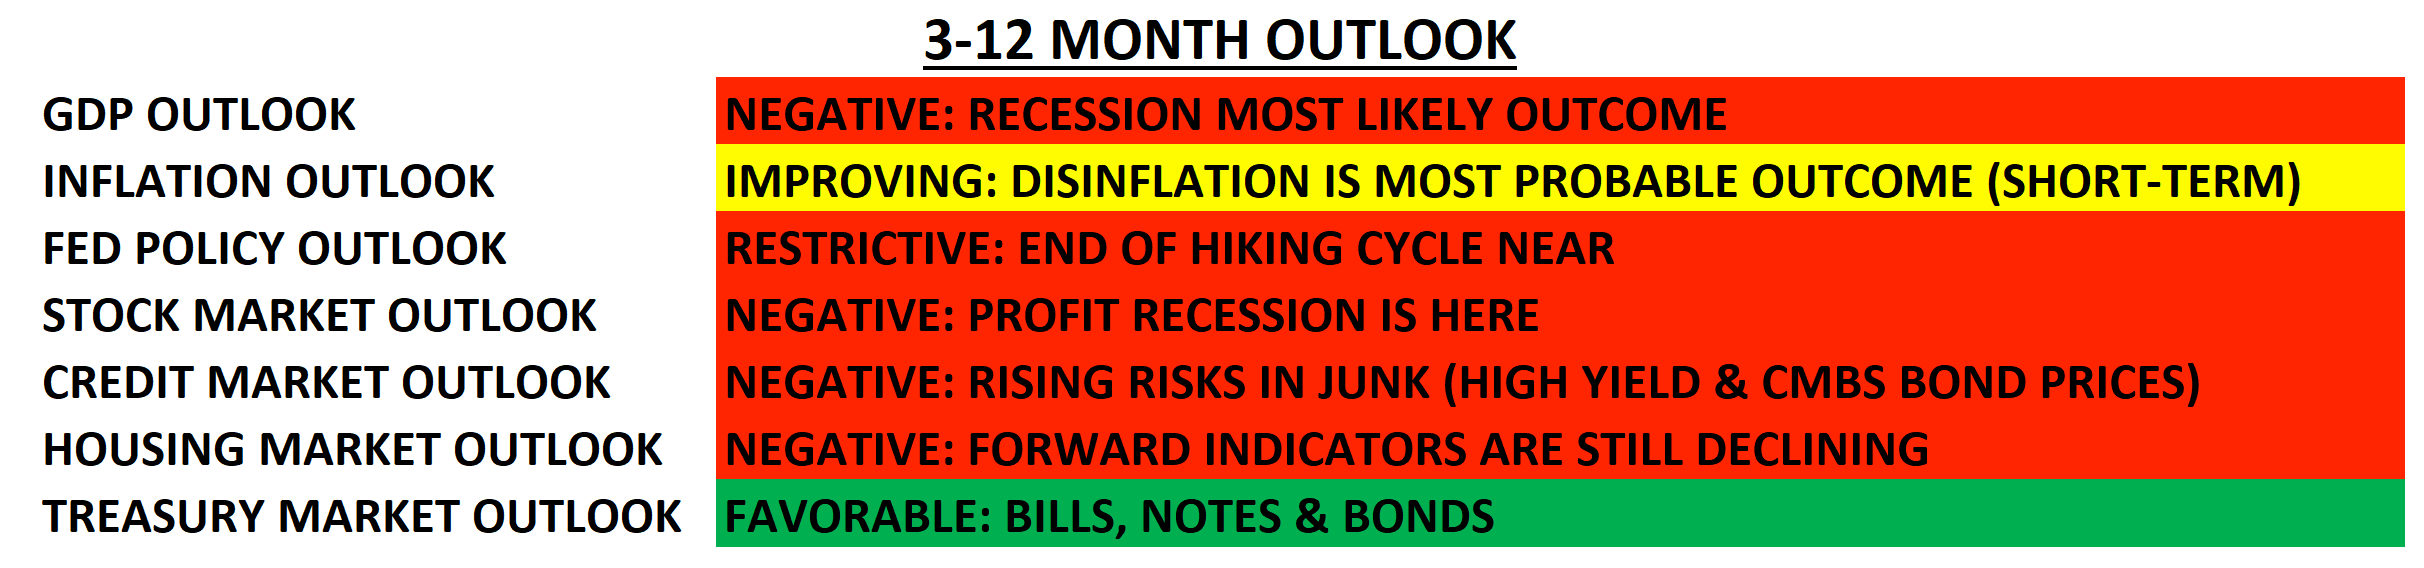
Overview
The narrow breadth of the stock market is a sign of the broad weakness in the economy. This year's gains in the S&P 500 are attributed to the performance of just seven companies whose valuations are once again stretching. These seven companies (Apple, Microsoft, Alphabet, Nvidia, Meta, Amazon, and Tesla) account for 100% of the S&P 500’s year-to-date gains. The S&P 500 is a market cap-weighted index, meaning the larger and more valuable companies receive a heavier weighting in the index. The seven stocks listed above account for just over 27% of the total weighting of the S&P 500. By comparison, the year-to-date return is slightly negative if we examine the equal-weighted S&P 500 index (where the above seven stocks only account for 1.4% of the weighting). Small-cap stocks are also struggling this year, with the Russell 2000 index slightly negative in 2023. One rule of thumb for investing is to be wary of markets that are rising on narrow breadth. Bad breadth means the rally is fragile.
Artificial Intelligence is the narrative du jour driving FOMO among investors. A.I. is not new; it has just come to the forefront of investor attention as other narratives (crypto) have fizzled out after the recent introduction of ChatGPT. We are reminded of the Dot Com mania in the late 90s…when no price was too high if you were an internet or tech company. Everyone knew the internet was going to change everything, and the internet did change everything. However, tech stocks like Amazon (AMZN) and Microsoft (MSFT) peaked in 1999 and did not reach new highs until 2009 for AMZN and 2016 for MSFT, even though their businesses continued to grow. In 1999 stock prices got way ahead of reality for the internet and tech business. The investors that chased the mania at the peak got burned badly. Eventually, it turned out that valuations did matter. Investors that were patient through the mania were rewarded with much lower entry points on these stocks in the 12 to 24 months following the mania.
There is no question that A.I. is innovative and may very well change everything in the coming years. But at what valuation do these companies make sense to buy? At the moment, we seem to be in this world where valuations don’t matter as long as you’ve got Artificial Intelligence or are even thinking about pursuing A.I. There is clearly a mania for A.I. stocks right now and we believe our patience will be rewarded with much lower entry points on these stocks once the excitement wanes. Nvidia (NVDA) is an example of an A.I. stock that seems to have gotten ahead of itself as investor expectations have gone to the stratosphere. NVDA currently trades at 36.2 times its sales!
For comparison:
· Currently, the S&P 500 stocks trade at an average of 2.3 times sales.
· Currently, the Nasdaq 100 stocks trade at an average of 4.4 times sales.
· In 1999, MSFT traded at 28.8 times sales at its peak.
· In 1999, AMZN traded at 28 times sales at its peak.
Once the bubble popped, Microsoft and Amazon took a decade or more to reclaim their prior peak levels. We don’t know if the peak is in yet for NVDA, but its business needs to grow substantially to justify the current valuation. If history is a guide, it could take a while. Just how expensive is NVDA stock at these levels? Consider this…if one were to buy NVDA today, and we assumed no growth, it would take 36.2 years to get your money back if 100% of the sales revenue were given to investors (never mind the company’s expenses). Equally as amazing to consider: the frenzied buying the day after NVDA’s recent earnings announcement added over $184B to the total value of the company…which happens to be greater than the total amount of sales this company has generated since its publicly traded existence (25 years) which totals only to $160B! So NVDA stock gained more value in a single day than their total revenue over the last 25 years; incredible! While NVDA makes an excellent product and their business will likely continue to grow, we will wait for the stock price to return to reality.
The stock market, led by these seven stocks and A.I. is rallying while the economy's fundamentals continue to weaken. Leading economic indicators continue to slow as investors ponder whether or not there will be a recession. Signs of a weak consumer continue to simmer, with real retail sales numbers negative year over year. Slowing headwinds remain on the economy with the FED still tightening and Fiscal stimulus being reduced (excess Covid funds being clawed back after the debt ceiling deal and student loan payments starting in August). The FED has continued to hike interest rates, which has a lagged effect on slowing the economy. The market seems to be excited by the thought of inflation coming down for the prospects of interest rates then dropping. However, while inflation has come down some from a year ago, prices are still rising faster than we have experienced in over 20 years. In reality, inflation coming down is more likely a sign of recession, based on history. With the economy slowing, the pace of inflation is likely to ease. However, core inflation has been slow to come down, which causes the FED to want to remain tight on interest rate policy. Housing (a leading indicator), as we have highlighted in prior writings, continues to slump, with the average 30-year fixed mortgage rate back above 7%.
It is easy to get excited by seeing the S&P 500 or Nasdaq move higher. Prices going up makes everyone “feel” like things must be fine, but sentiment can turn on a dime, just as it did from this past December to January. With interest rates up and inflation sticky, we are unlikely to get any relief from the FED until a recession forces their hand. Until the economic fundamentals show improvement, we believe the prudent move is to remain cautious.
Model Positioning
Over the past month, we slightly reduced inverse equity exposure to help weather the bounce. Additionally, with the pullback in precious metals and oil, we have added starter positions in gold, silver, and energy stocks, each of which we plan to add to in the coming months. Overall, portfolio models remain very defensive. We continue to view short-term treasury notes (1 year or less to maturity) as an attractive place to park capital in the short term while we await a better, lower entry point for stock exposure. All models' small percentage of stock exposure focuses on defensive sectors, value, and high dividends.
We expect the market to remain volatile in 2023. To navigate this volatility, we will adjust exposures (long and short) based on our macroeconomic and market indicators to reduce portfolio volatility and protect capital. Market risk remains elevated, and we remain cautious.
Keys to the Market
PE Ratio vs. EPS – The following chart illustrates how the fundamentals haven’t changed while technology stock valuations have been soaring again over the last six months. Earnings, measured by tech sector EPS (Earnings Per Share), have declined by 6.5% over the last year. Meanwhile, tech stock valuations have climbed by 45%, as measured by the PE Ratio (Price/Earnings). A higher PE ratio means investors are paying a higher price per dollar of a stock's earnings.

Real Retail Sales – This chart measures U.S. real retail sales (U.S. retail sales adjusted for inflation). Over the last 50 years, any time this metric has moved into negative territory, the U.S. economy has been in, or very near, a recession. Weak retail sales are a sign of consumer weakness.

Narrow Market Breadth – As mentioned above, the gains in the S&P 500 can be attributed to just seven stocks. We are currently seeing the largest outperformance of the S&P 500 versus the equal-weighted S&P 500 since 1998 and 1999 (tech bubble).

Our goal is to help you grow your wealth over time while managing the risk of significant drawdowns along the way. Markets never go in a straight line. As we remain defensive, awaiting indication from our technical and economic signals for the time to get bullish, patience is needed to ride out the storm. We remain vigilant in navigating these uncertain markets and searching for the start of the next meaningful uptrend in the stock market. During the course of our relationship, we have worked with you to establish a portfolio that matches your financial planning needs, risk tolerance, and investment timeline. It is critical to remain patiently invested in the appropriate model. Stick to the plan!
Please do not hesitate to contact us with any questions, comments, or to schedule a portfolio review.
Sincerely,
Lake Hills Wealth Management