

Beware of False Dawns
Beware of False Dawns
LHWM Market Quick View-January 2023

Key Take Away
The wide-ranging views among investment experts are as vast as we can recall. Simply watch CNBC or Bloomberg for an hour to hear some guests make a case for an economic soft landing while others predict a deep recession. One might wonder how these “experts” can arrive at such differing outlooks… The data has been distorted due to the pandemic, but it all boils down to assumptions about the future regarding monetary policy, fiscal policy, geopolitics, inflation, consumer cash balances, the China re-opening, etc. While there seem to be shortages of many things these days, there is no shortage of economic uncertainty and euphoria in risk assets. As a recession remains our base case scenario for 2023, we remind our clients to be cautious when others are greedy and to beware of false dawns, i.e., the U.S. Recession has been avoided.
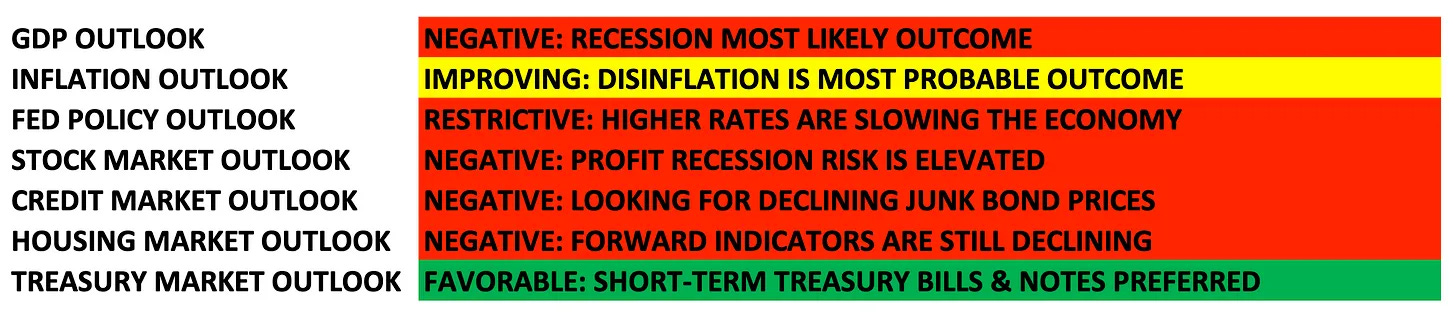
No one knows the future; it is merely a distribution of probable outcomes. We rely on our data-driven process to assign probabilities to the most likely outcomes and to guide portfolio construction. Key components of our process include the tracking of economic data (accelerating or slowing?), inflation (increasing or decreasing?), and central bank monetary policy (tightening or loosening?). This assessment provides a framework for risk and how a portfolio can best be allocated to mitigate that risk. Slowing economic data (observed over the last twelve months), slowing but high inflation and restrictive FED policy are all important to identify. As a reminder, markets tend to move down significantly before and during an NBER (National Bureau of Economic Research) classified recession, and we believe that will be the real story of 2023-2024.
The outlook for real economic growth and corporate profits remains paltry. Economic data continues to slow. Corporate profits have continued to decline. Consumer budgets are under pressure, and debt levels are still climbing. The more the economy slows, the greater the risk of recession. Just like riding a bike, it is very easy to stay balanced when cruising at a nice pace, one may not even need to hold the handlebars. However, once momentum is lost, it suddenly becomes difficult to stay balanced. A fall becomes all but inevitable. The economy is the same as the bike, and for now, it is slow and unsteady as she goes…
U.S. Outlook (Next 3-12 Months)
Overview
After a brutal twelve months for the stock and bond markets, the calendar has finally rolled into a new year. Good riddance to 2022! It seems that with the arrival of 2023, suddenly, all the problems with earnings deceleration and the economy are gone. At least, that is what the stock market would have you believe with the first couple weeks of trading. If only it were that simple!
The U.S. stock market continues to look expensive from our view. Especially compared to treasury bonds, which are the building blocks for all risk assets. The outlook for the bond market has improved relative to stocks. Especially if you believe we are headed toward a recession. For example, the yield on a 1-year Treasury note has been hovering around 4.7%...this is considered a risk-free return. That’s nearly 5% with very little risk involved. Now consider the S&P 500, which at the time of this writing, is trading around 4,000. If buying the S&P 500 today, one expects to earn around 5.9% over the next 12 months from future projected earnings. Where did 5.9% come from? The forward earnings yield is calculated by taking the next 12 months of estimated earnings of $235/share (per Wall St. analysts) and dividing that by the current S&P 500 price of 4000, which equals 5.9%. As prudent investors, we must compare the earnings yield of the S&P 500 to the risk-free rate. In this case, we use the 10-year treasury yield of 3.44%. After subtracting the risk-free rate from the earnings yield, we arrive at 2.46%, this is the current equity risk premium or the additional return an investor expects for accepting the added risk of the S&P 500. To put that in context, the historical average equity risk premium is in the 4-5% range. So 2.46% is very low and unattractive, especially given current recession risks. The lower the risk premium, the more expensive stocks are, and vice versa. Why buy stocks when you can buy Treasuries and earn 4.7% with little risk? (Source: Bloomberg)
The treasury yield curve continues to be massively inverted, meaning short-term rates are significantly higher than long-term rates. This is a time-tested indication that a recession is on the horizon. Keep in mind that the yield curve is inverted because the FED is hiking short-term rates (loan rates) to slow the economy in the name of fighting inflation. In doing so, long-term rates decline as inflation and growth decline. So, the FED wants an economic slowdown, and the yield curve tells us a slowdown is coming. Meanwhile, the stock market is trying to rally again in hopes that the economy only modestly slows without major job losses (soft landing). The bull market of 2020/2021 was fueled by unprecedented stimulus and record-low interest rates. Today, we have the opposite, no stimulus in sight and the highest interest rates since 2007. Fundamentally, it is very unlikely stocks can have a sustainable rally from here (without significant changes), given all the macro headwinds. We believe the prudent move is to stay defensive for now while getting paid to wait in treasury bonds.
The head-to-head battle between stocks and bonds is at hand. The stock and bond market are currently at odds with each other as the former is pricing in a soft landing, and the latter is pricing a growth slowdown. If a recession happens, the bond market is the place to be, while stocks are best avoided. If a recession is avoided, the bond market is incorrectly priced, and yields will rise while stocks have room to go up. Historically, a soft landing has been achieved around 20% of the time…not a high probability (especially given the rapid increase in rates over a short period of time) that we’re comfortable with. Given that low probability and our model output, we favor bonds.
Looking back at history, the stock market never goes down without a fight. Bear markets are notorious for large, short-lived rallies. This bear market has been no different, with several rallies last year that ultimately failed and went back down to new lows. Eventually, as the economy bottoms, there will be a buyable bottom for stocks. We likely won’t know it is the bottom until it is in the rearview mirror. However, just as our process guided us to shift to a risk-off portfolio at the end of January 2022, the data will guide us on when it is time to get back in.
Model Positioning
Given our outlook for the economy, all models remain defensive. Short-term treasury notes continue to offer attractive risk-adjusted returns relative to stocks. Long-term bonds (10-30-year maturities) continue to look interesting. We’ve kept exposures to these long-term bonds minimal as we plan to watch and wait for buying opportunities. The small amount of stock exposure in all models focuses on defensive sectors. We also continue to hold precious metals exposures.
We expect market volatility will continue in 2023. Remember that we will adjust the amount of stock exposure (long and short) based on short-term market fluctuations to risk manage volatility. Market risk remains elevated, so we remain cautious.
Keys to the Market
Empire State Manufacturing Survey – Last month, we highlighted the dismal Chicago PMI as it plunged to contraction territory. This month, we highlight the Empire State Manufacturing Survey for another read on the future pulse of activity. Manufacturing activity continues to decline. With the current reading of -32.9, this is another recessionary reading on manufacturing.

*Red shaded areas indicate NBER-defined U.S. Recession
Stock/Bond Ratio – The stock-bond ratio is a way of measuring the relative performance of stocks versus bonds. When the ratio goes up, stocks outperform bonds. When the ratio declines, bonds outperform stocks. The chart below compares the ratio of the S&P 500 (stocks) vs. the Bloomberg Aggregate Bond Index (Bonds) and how it behaves relative to PMI (leading economic indicator: below 50 is contraction, above 50 is expansion). Recently, this stock-bond ratio has been declining as bonds have been outperforming stocks. Generally, we would not expect meaningful improvement (certainly not new highs) in the stock/bond ratio until PMI moves back above 50.
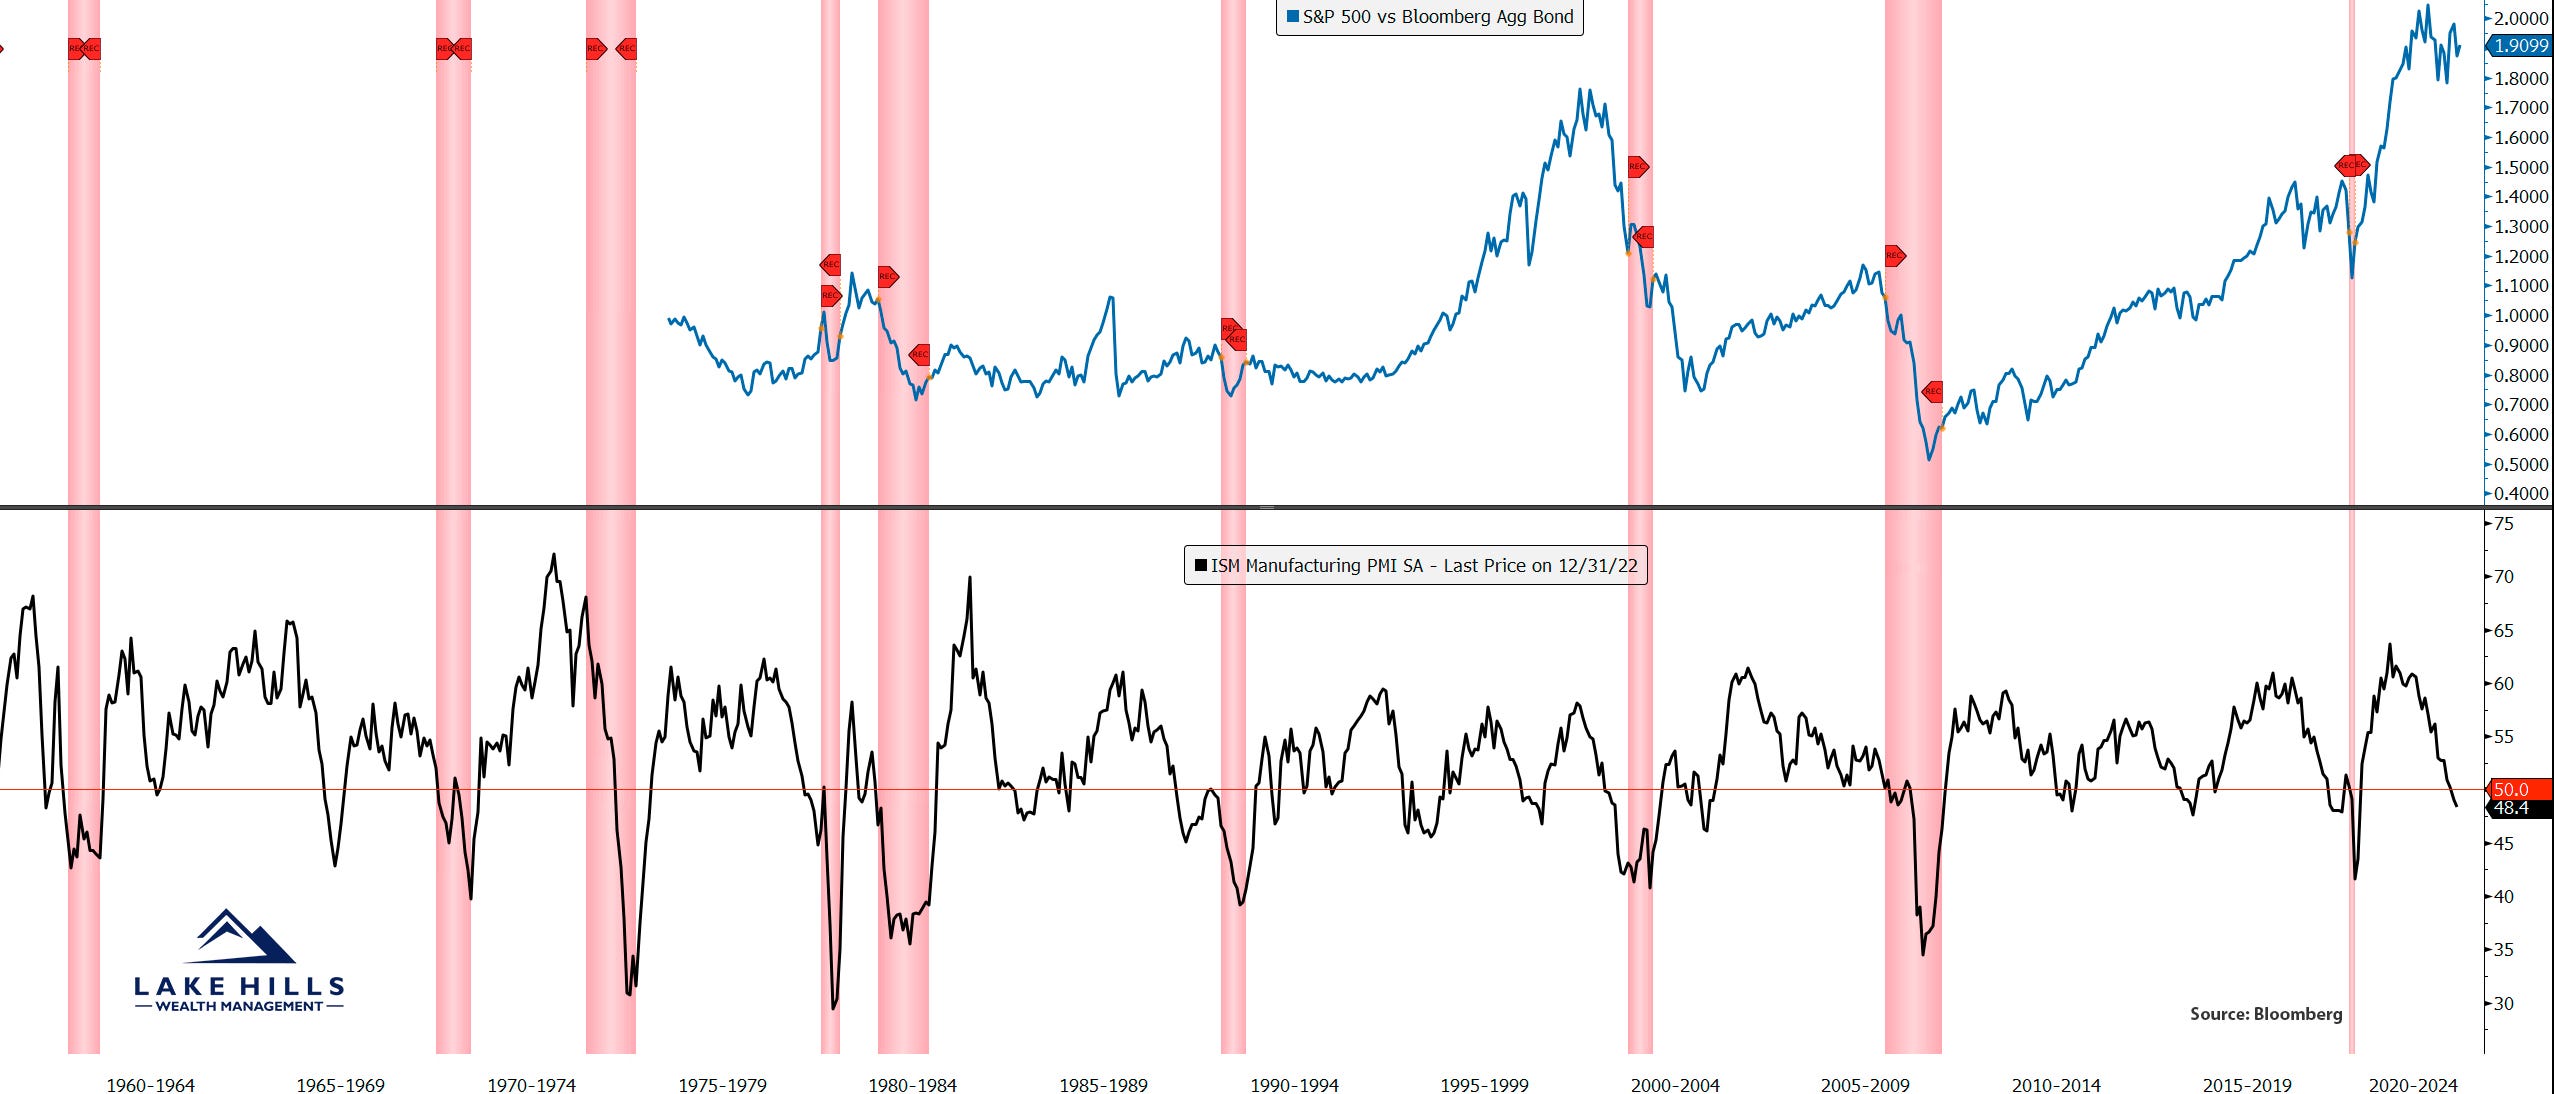
*Red shaded areas indicate NBER-defined U.S. Recession
Global GDP Tracker – Global GDP growth peaked in 2021 and has slowed. It is often good to zoom out to see the big picture. It is amazing how much GDP has slowed once the stimulus and low-interest rates were removed from the equation.
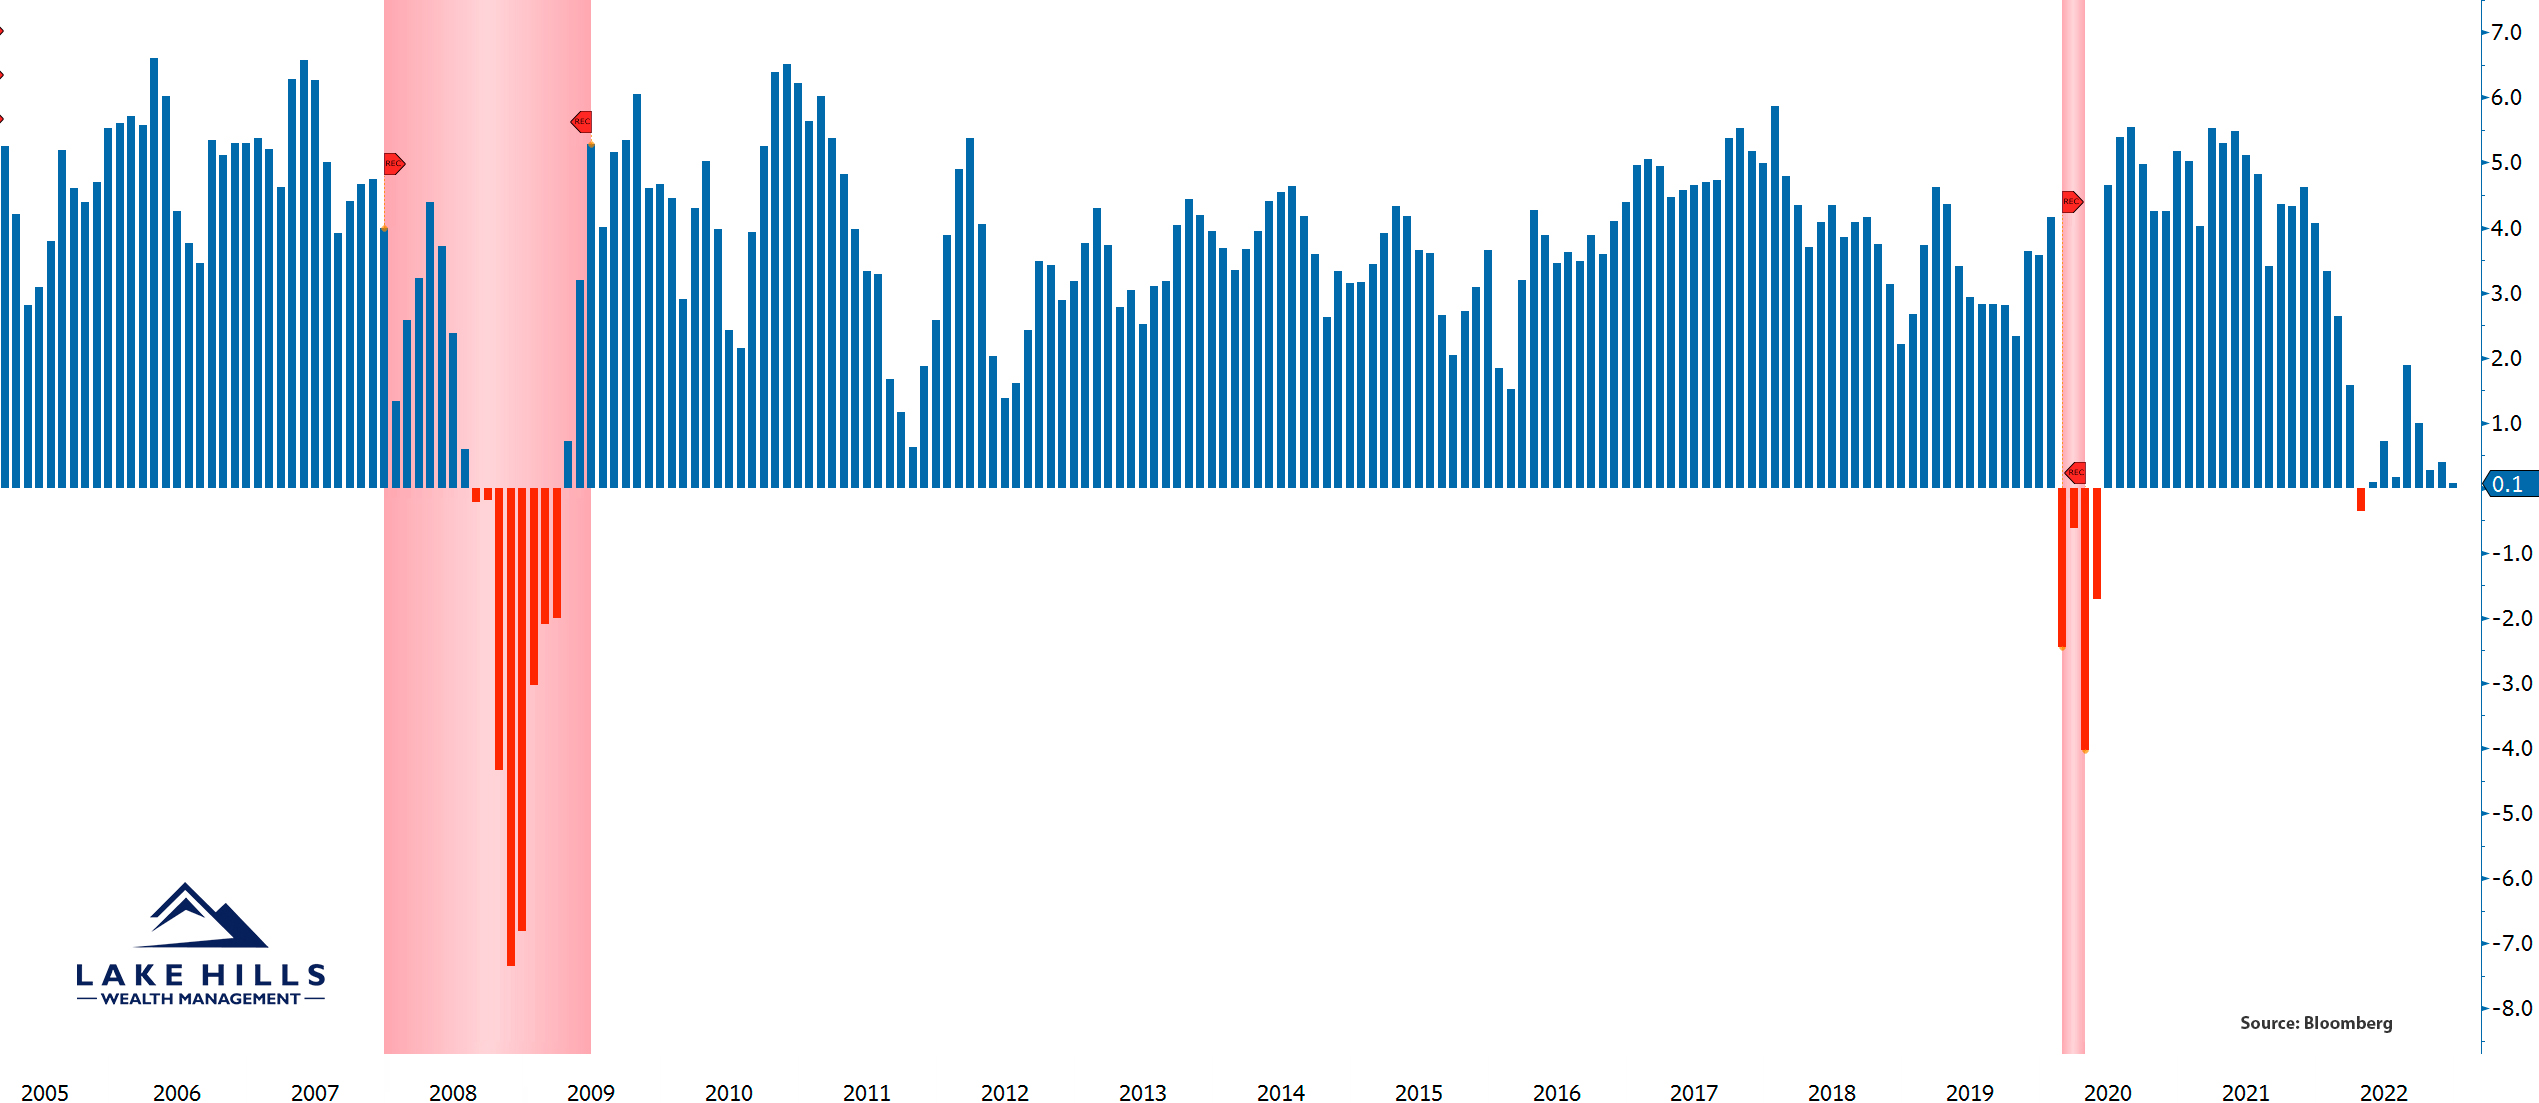
*Red shaded areas indicate NBER-defined U.S. Recession
Patience continues to be key as these bear markets take time to play out. With the arrival of 2023, nothing has changed, so neither have we. We remain conservatively positioned in all models and vigilant in navigating these uncertain markets. During the course of our relationship, we have worked with you to establish a portfolio that matches your financial planning needs, risk tolerance, and investment timeline. That said, it’s critical to remain patiently invested in the appropriate model. Stick to the plan!
Please do not hesitate to contact us with any questions, comments, or to schedule a portfolio review.
Sincerely,
Lake Hills Wealth Management