

Fear and Greed

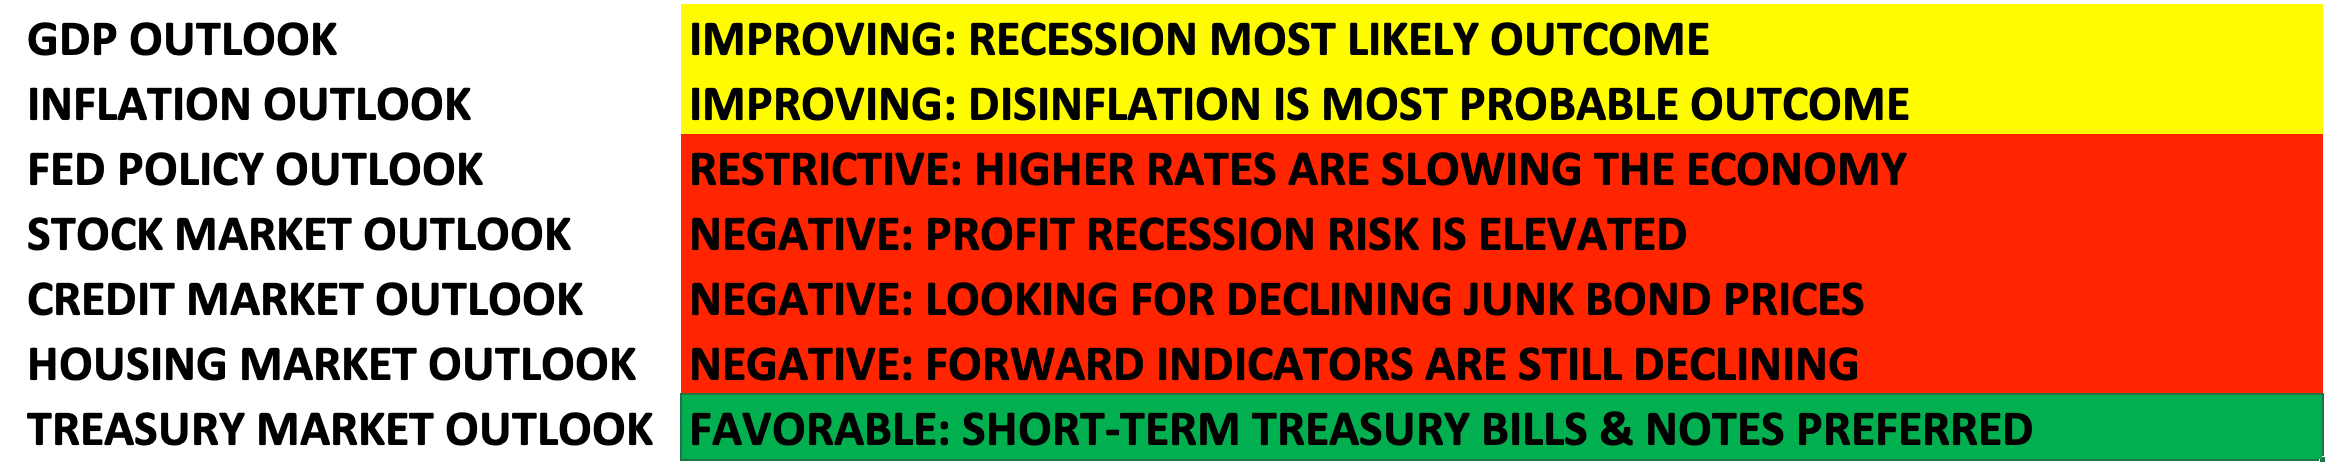
Key Take Away
Bear markets are diabolical. They have a knack for exacting the maximum amount of pain on the maximum number of investors as sentiment swings from extreme Fear to extreme Greed.
In December, bearish sentiment got to an extreme level as investor concerns about the economic outlook grew. Towards the end of December, investors continued to reduce stock exposure to reduce portfolio risk and capture losses for tax reasons. Then, like a pavlovian dog hearing a bell ring in January, dip buyers and the macro-unaware machines began buying the most beaten-down stocks, often with the poorest fundamentals. After a couple of weeks of positive gains for the markets, suddenly things don’t feel so bad. With prices going up, investor sentiment improves. Before long, FOMO (fear of missing out) sets in as people and machines chase the market, jumping back into stocks, bonds, and commodities, which is the opposite of what the Fed wants to see. According to our work, we believe stocks and long-term bonds are wrong here, which again sets the market up for a decline (stocks go down and yields go higher). as we complete the bear market's last and most vicious final stage.
The fundamentals (valuations, earnings, and economic drivers) remain poor. The corporate earnings outlook remains weak as year-over-year earnings are now negative. The job market has remained strong, but this is partly due to employers’ fears of being unable to rehire needed talent in the future since the job market has been so tight post Covid. So corporate America has been hoarding its workers while wages are rising. This adds profit margin pressure (great for employees, bad for profits). When expenses remain elevated while revenues and prices decline, profits get squeezed, and declining profits are bad for stocks. Subsequently, inflation remains uncomfortably high, forcing the FED to keep rates elevated, with more rate hikes likely in the queue. Rising interest rates cause the economy to slow, especially in a highly indebted economy. With this said, we are reiterating our earnings/economic recession call and thus remain defensively positioned.
U.S. Outlook (Next 3-12 Months)
Overview
For the last few months, investors have been hoping for “immaculate disinflation,” a low-probability scenario where the economy continues to grow (albeit at a slower pace), and inflation declines, allowing the FED to stop hiking and start cutting rates around mid-year. This scenario is possible, but history indicates a probability of around 20% as recessions are more often the outcome of rate hiking cycles. So far, the economy has been resilient despite the terrible housing data and poor leading economic indicators. After all, consumers have continued to spend and borrow no matter the price, but how long will they accept higher prices? When will they run out of funds? Given recent trends; declining savings, record borrowing (despite higher rates), tightening of bank lending standards, negative real wages, the end of the COVID emergency measures (CHIP and health insurance subsidies), and the possible restarting of student loan payments, we believe consumer spending will be challenged. (Source: Bloomberg)
With the arrival of February, the January stock market bounce has stalled, and investors are once again becoming concerned that inflation is not going away easily. January inflation figures came in hotter than expected, and December inflation numbers were revised higher… Additionally, the jobs market has remained strong. This sounds great on the surface, but the implications are the FED will continue hiking rates, further pressuring the economy to slow. Previously the market was rallying because inflation was thought to have slowed faster than expected, and thus hopes the FED may not need to continue hiking. Holes have been punched in that thesis.
FED monetary policy is known to have long and lagging effects on the economy. The first rate hike was a little under a year ago. The slowing effects of the rate hikes have been showing up in the most rate-sensitive sectors, like housing and autos, but it takes more time to show up in other parts of the economy. Consequently, with rates up, borrowing costs are up. A substantial amount of corporate debt matures during the next 18 months. Assuming rates remain high during that period, the debt refinanced will be at a higher rate/cost, adding further profit margin pressure and potentially a rise in corporate defaults. (Source: Bloomberg)
As discussed last month, analysts have a wide range of economic views. This disparity fuels market volatility. When stocks start going up, many investors not positioned for a rally end up chasing the market higher (adding more stock exposure after the bounce). However, it works both ways. When the tide turns negative for the markets again (we believe that it will), investors who are not properly positioned for a decline will become motivated to sell, adding further downward pressure the the markets. It’s an ugly cycle that is difficult to navigate.
Model Positioning
With corporate profits under pressure and S&P 500 earnings now negative year-over-year, all models remain defensive. Short-term treasury notes continue to offer an attractive risk-adjusted return relative to stocks. We believe this is a good place to park capital while we await a better, lower entry point for increasing stock exposure and/or long-term treasury bonds. The small percentage of stock exposure in all models focuses on defensive sectors, value over growth, and high dividends. We also continue to hold precious metals exposures, although we have reduced them due to recent weakness. (Source: Bloomberg)
We expect corporate earnings will continue to disappoint and for market volatility to continue. Remember that we will adjust stock exposure (long and short) based on our macroeconomic and market indicators to reduce portfolio volatility and protect capital. Market risk remains elevated, so we remain cautious.
Keys to the Market
Senior Loan Officer Survey – The Fed conducts this survey, and the results depict changes in bank lending standards and the state of business and household demand for loans. The blue line below shows how bank lending conditions are tightening, notice what happened in the past when bank lending standards tightened. During weak economic periods, banks want to limit loans (potential loan losses) to less credit-worthy borrowers. The orange line in the chart shows the current low unemployment rate. In the past, the sharp tightening of lending standards has been a precursor to higher unemployment and a breakdown in credit spreads.

*Red shaded areas indicate NBER-defined U.S. Recession
Manufacturing New Orders & Building Permits – The blue line shows that manufacturing new orders continue to decline deeper into contraction territory with a reading of 42.5 (right column). Levels this low have only been seen during recessions during the past 60 years. We have highlighted manufacturing data several times over the past year because it backtests as one of the better leading economic indicators. We have also mentioned in our previous writings that the housing sector (interest rate sensitive) is a leading economic sector. The red line shows building permits (leading housing indicator) for housing continuing to decline with a reading of 1339 (left column). Declining housing activity leads to declines in other sectors of the economy. The bottom panel (gold line) shows the year-over-year percent change in building permits. Whenever manufacturing new orders drops below 47 while the year-over-year change in housing permits is -20% or more, we’ve had a U.S. recession with the exception being the mid-1960s.
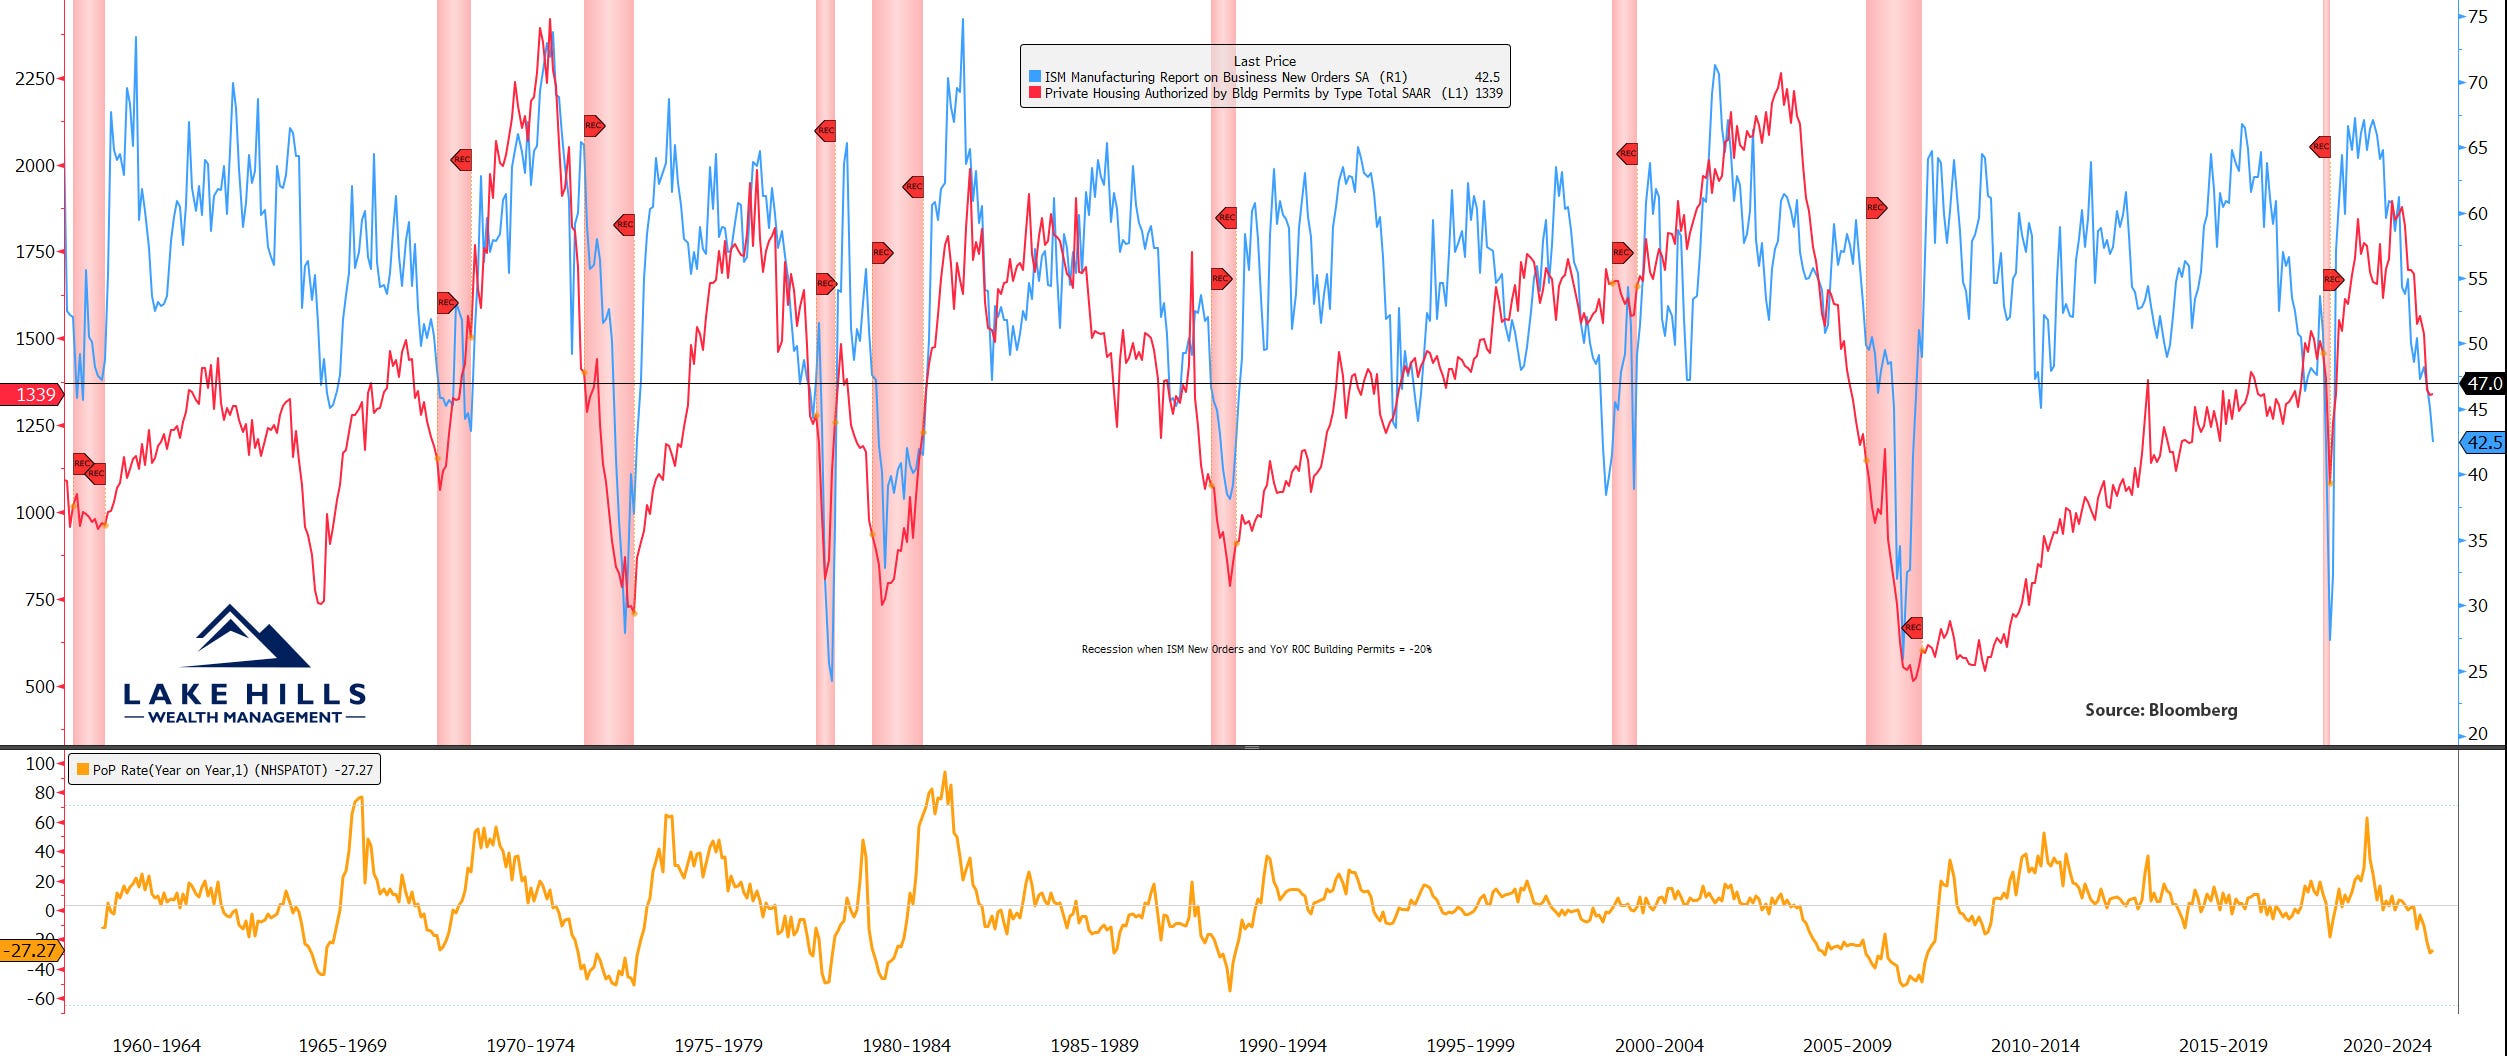
*Red shaded areas indicate NBER-defined U.S. Recession
Construction Employment – Here is a chart for the bulls. Construction employment has remained strong thus far despite the terrible data from the housing sector. Typically, construction employment begins to soften before recessions, but so far, we haven’t seen that yet. One possible explanation is the dynamic between existing homes to new homes. A large percentage of recent home purchases have been new homes vs. existing homes. Many Americans have a very low mortgage rate and are choosing to stay put, keeping the supply of existing homes for sale low. New homes, can be discounted by the builder. Some builders have been offering a variety of incentives including lower mortgage rates (the builder offers to buy down the mortgage rate). The recent pick-up in new home buyer activity (due to lower mortgage rates during the first part of the year) could be causing home builders to hold on to their labor in hopes that the economy doesn’t enter a recession this year and activity returns to normal. This dynamic, combined with a tight labor market and infrastructure spending due to the Inflation Reduction Act, may be the cause. While there are some plausible explanations for why construction employment has remained high, we think it may yet rollover as high mortgage rates are likely to persist. We’ll continue to monitor this trend.
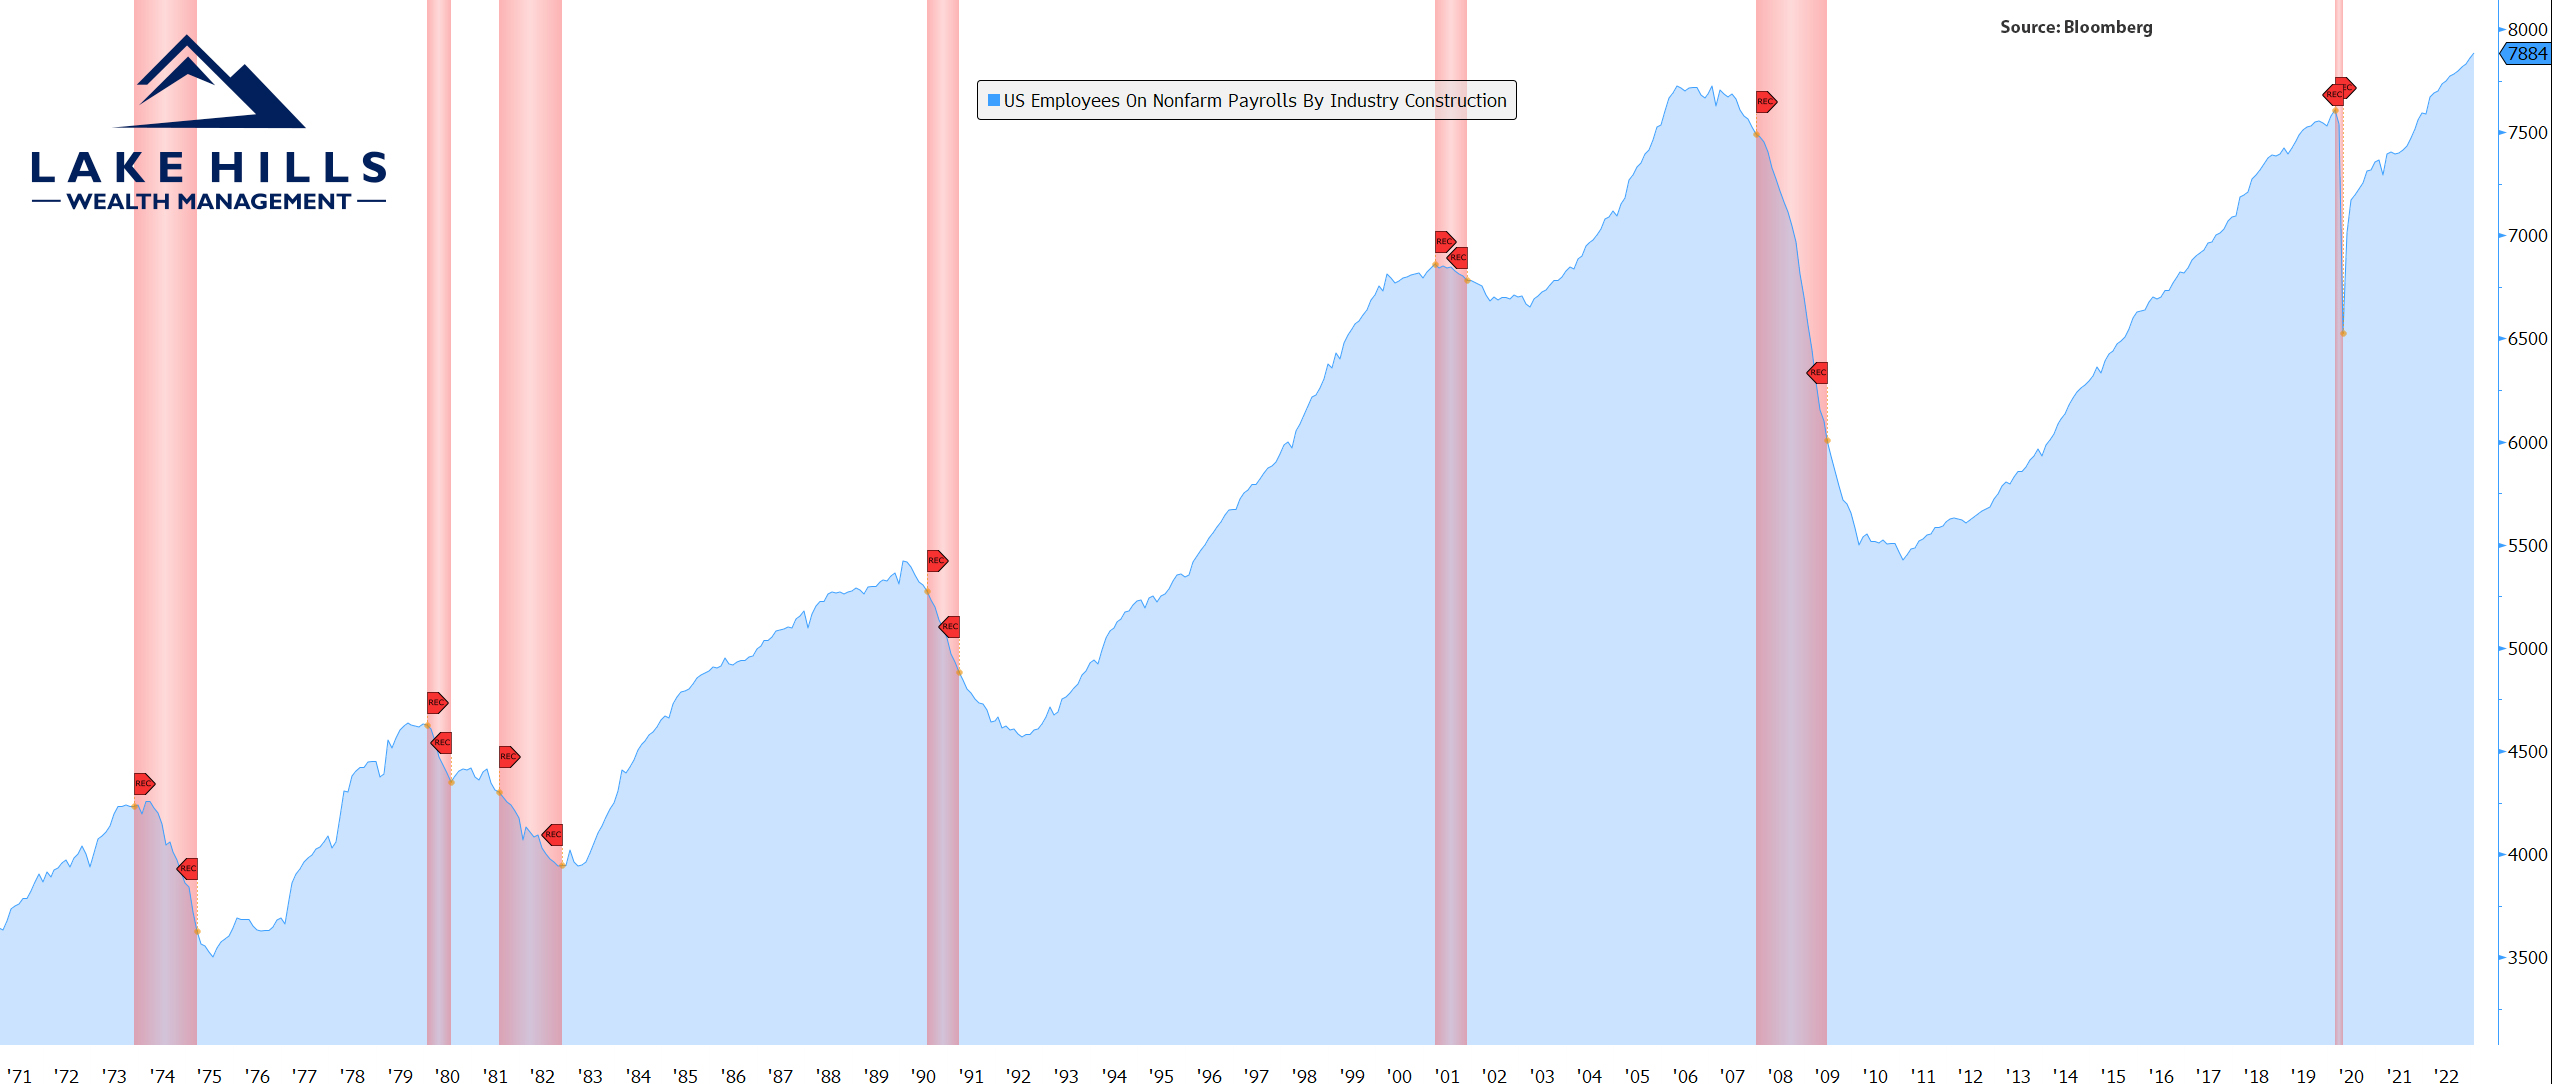
*Red shaded areas indicate NBER-defined U.S. Recession
Big stock market rallies are a hallmark of bear markets. Markets never go in a straight line. As we remain defensive, awaiting indication from our technical and economic signals for the time to get bullish, patience is needed to ride out the storm. We remain vigilant in navigating these uncertain markets and searching for the start of the next uptrend in the stock market. During the course of our relationship, we have worked with you to establish a portfolio that matches your financial planning needs, risk tolerance, and investment timeline. It is critical to remain patiently invested in the appropriate model. Stick to the plan!
Please do not hesitate to contact us with any questions, comments, or to schedule a portfolio review.
Sincerely,
Lake Hills Wealth Management