

The Waiting Game

Key Take Away
Despite weak leading economic conditions, the stock market has remained somewhat buoyant this year. In reality, it has been just seven stocks that have propped up the entire market. In this sense, things aren’t as good as advertised. The equal-weighted S&P 500 (as opposed to the cap-weighted S&P 500 that weights more toward the largest companies) and the Russell 2000 (small companies) are flat to negative in 2023. This means most stocks have not faired well this year, which, so far, doesn’t bode well for those calling this a new bull market for stocks. The bear market in stocks is nearly two years old, while the bear market in bonds is in its third year. Since July, stocks have resumed their troubles as bond yields have been making new highs. The US economy has improved somewhat this year, but the overall global economy looks fragile. Given our analysis, we think it is prudent to wait and see how the forward economic indicators and market signals unfold before returning portfolios to historical stock allocations. After all, if we are correct and a downturn is near, adding stocks at the end of an economic cycle can be a risky proposition. (Source: Bloomberg & Apollo U.S. Outlook (Next 3-12 Months)

Overview
As mentioned, the current bear market in stocks has been ongoing for nearly two years now, while the bond bear market is nearing the completion of its third year. It has not been an easy environment to navigate. The stock market is widely followed and reported, however, while stocks have had a rough ride, the bond market is currently experiencing its worst downturn in modern history. Due to the rapid increase in interest rates from historic COVID-19 lows, bond prices have been sharply adjusted lower. For example, long-term U.S. government treasury bonds (20+ years to maturity) have repriced lower by more than 50% from their peak in the Summer of 2020. This is worse than the decline stocks experienced during the 2008 financial crisis. The banks bought many of these bonds in 2020 and 2021, contributing to this year's troubles in the finance sector. (Source: Bloomberg and BofA)
Economic conditions have drastically changed over the last two years, with high inflation becoming a significant headwind to real growth and asset prices. The FED has been hiking interest rates for the last 18 months, trying to put the inflation genie back in the bottle. Meanwhile, the U.S. government has continued spending extraordinary amounts of money, stressing the already fragile treasury market. The U.S. government has added $10 trillion to our debt since March 2020 and $2.17 trillion so far this year. These two forces counterbalance each other to an extent (the Fed’s hiking cycle and government spending). Interest rate hikes are meant to slow inflation by slowing demand. Large deficit spending by the government effectively increases demand and is inflationary. Government spending (stimulus, CHIPS & Science Act, and infrastructure spending) has contributed to economic resilience over the last few years while leading economic indicators have been negative for the last 17 months. These counterbalancing forces are causing interest rates to remain higher for longer while real economic growth is stagnant. (Source: Bloomberg)
In all likelihood, this ends with a recession. The difficult part is the timing, as many factors come into play. It is essentially a waiting game at this point, which can be difficult. The longer things remain stagnant, the more antsy investors become. This leads to seemingly nonsensical swings in the stock market. Interest rate hikes take time to work through the economy to slow demand. Yet, the headwind they provide is persistent. After a prolonged rate hiking cycle, the economy typically slows so much that a recession is induced once demand and liquidity are effectively reduced enough to help ease inflation. In the meantime, rates will likely remain high until recession becomes evident.
Lately, we’ve witnessed a re-steepening of the yield curve as long-term rates have been increasing, approaching the level of short-term rates. This has reduced the level of yield curve inversion. While the inverted yield curve is widely known to be a warning sign for oncoming recessions. The eventual re-steepening of the curve has tended to signal the beginning of recessions (see chart below). We’ll see if this trend continues, but ultimately, we expect the Fed to eventually cut short-term rates, causing the yield curve to finally re-steepen, which is usually a perilous time for stocks and the economy.
We remain patient, waiting for data and indicators to provide reasons to be more bullish. We are watching for improvements in the Leading Economic Index, the energy markets, treasury issuance, and a reacceleration in global manufacturing. When these things begin to show improvement, and our indicators give an all-clear signal, we will increase equity exposure and invest for longer-term growth again. Until then, the smart money plays defense. Historically, the current economic and market conditions align most with periods of poor stock market outcomes, so patience is key.
Model Positioning
Short-term treasury notes continue to be the largest portfolio holding. We have recently used proceeds from maturing 12-month notes, purchased last year, to buy new 24-month notes with yields of just over 5%. We believe this continues to be the best risk-adjusted investment opportunity as we wait for a better stock market setup.
Portfolio models continue to be underweight equity exposure with holdings in defensive sectors such as health care, staples, utilities, and other investments such as energy and miners. After the recent pullback in the stock market, we have removed the inverse equity exposure from portfolios for now, but that can change. While the economy should start to stumble, the stock market often has a mind of its own. We will watch our short-term indicators to determine the next strategic portfolio adjustment.
Usually, it is ideal to overweight into stocks when economic tailwinds are present. Our main thesis remains that recession odds are high, and interest rates will likely remain high and restrictive until the economy falters. The longer rates remain high, the more susceptible stocks will be to repricing lower. Additionally, the cost of debt will most likely create a toxic environment for the highly indebted members of the economy. Unfortunately, it may take some time for things to play out. We expect the market to remain volatile as long as economic growth remains weak and inflation remains high. To navigate this volatility, we will continue to adjust exposures (long and short) based on macroeconomic and market indicators to reduce portfolio volatility and protect capital.
Keys to the Market
Equity Risk Premium – This is a measure of expected reward (premium) for stocks (the S&P 500 in this case) above what can be earned in a risk-free investment (treasury bonds). We calculate the earnings yield for the S&P 500 by taking the consensus forward earnings per share estimates for the S&P 500 and dividing them by the current price of the S&P 500. Then, we subtract the risk-free rate (the current yield of a 10-year treasury bond is about 4.83%) from the earnings yield to find the ERP (equity risk premium). The ERP for the S&P 500 has now declined to 0.806%. This implies there is very little expected additional return for stocks vs bonds over the mid-term time horizon. The ERP has also worsened from the last time we highlighted this chart in November 2022, when it was 1.26%. Very low when compared to the 15-year average of 5.6%. Mid to long-term performance for investors in the S&P 500 is best for those who buy when the ERP is at a peak and poor for investors who buy when the ERP is at a low. Can the ERP go lower while stocks go higher? Yes, but when the low ERP is combined with all the other indicators we monitor, historically, stocks have experienced poor outcomes in past similar scenarios.
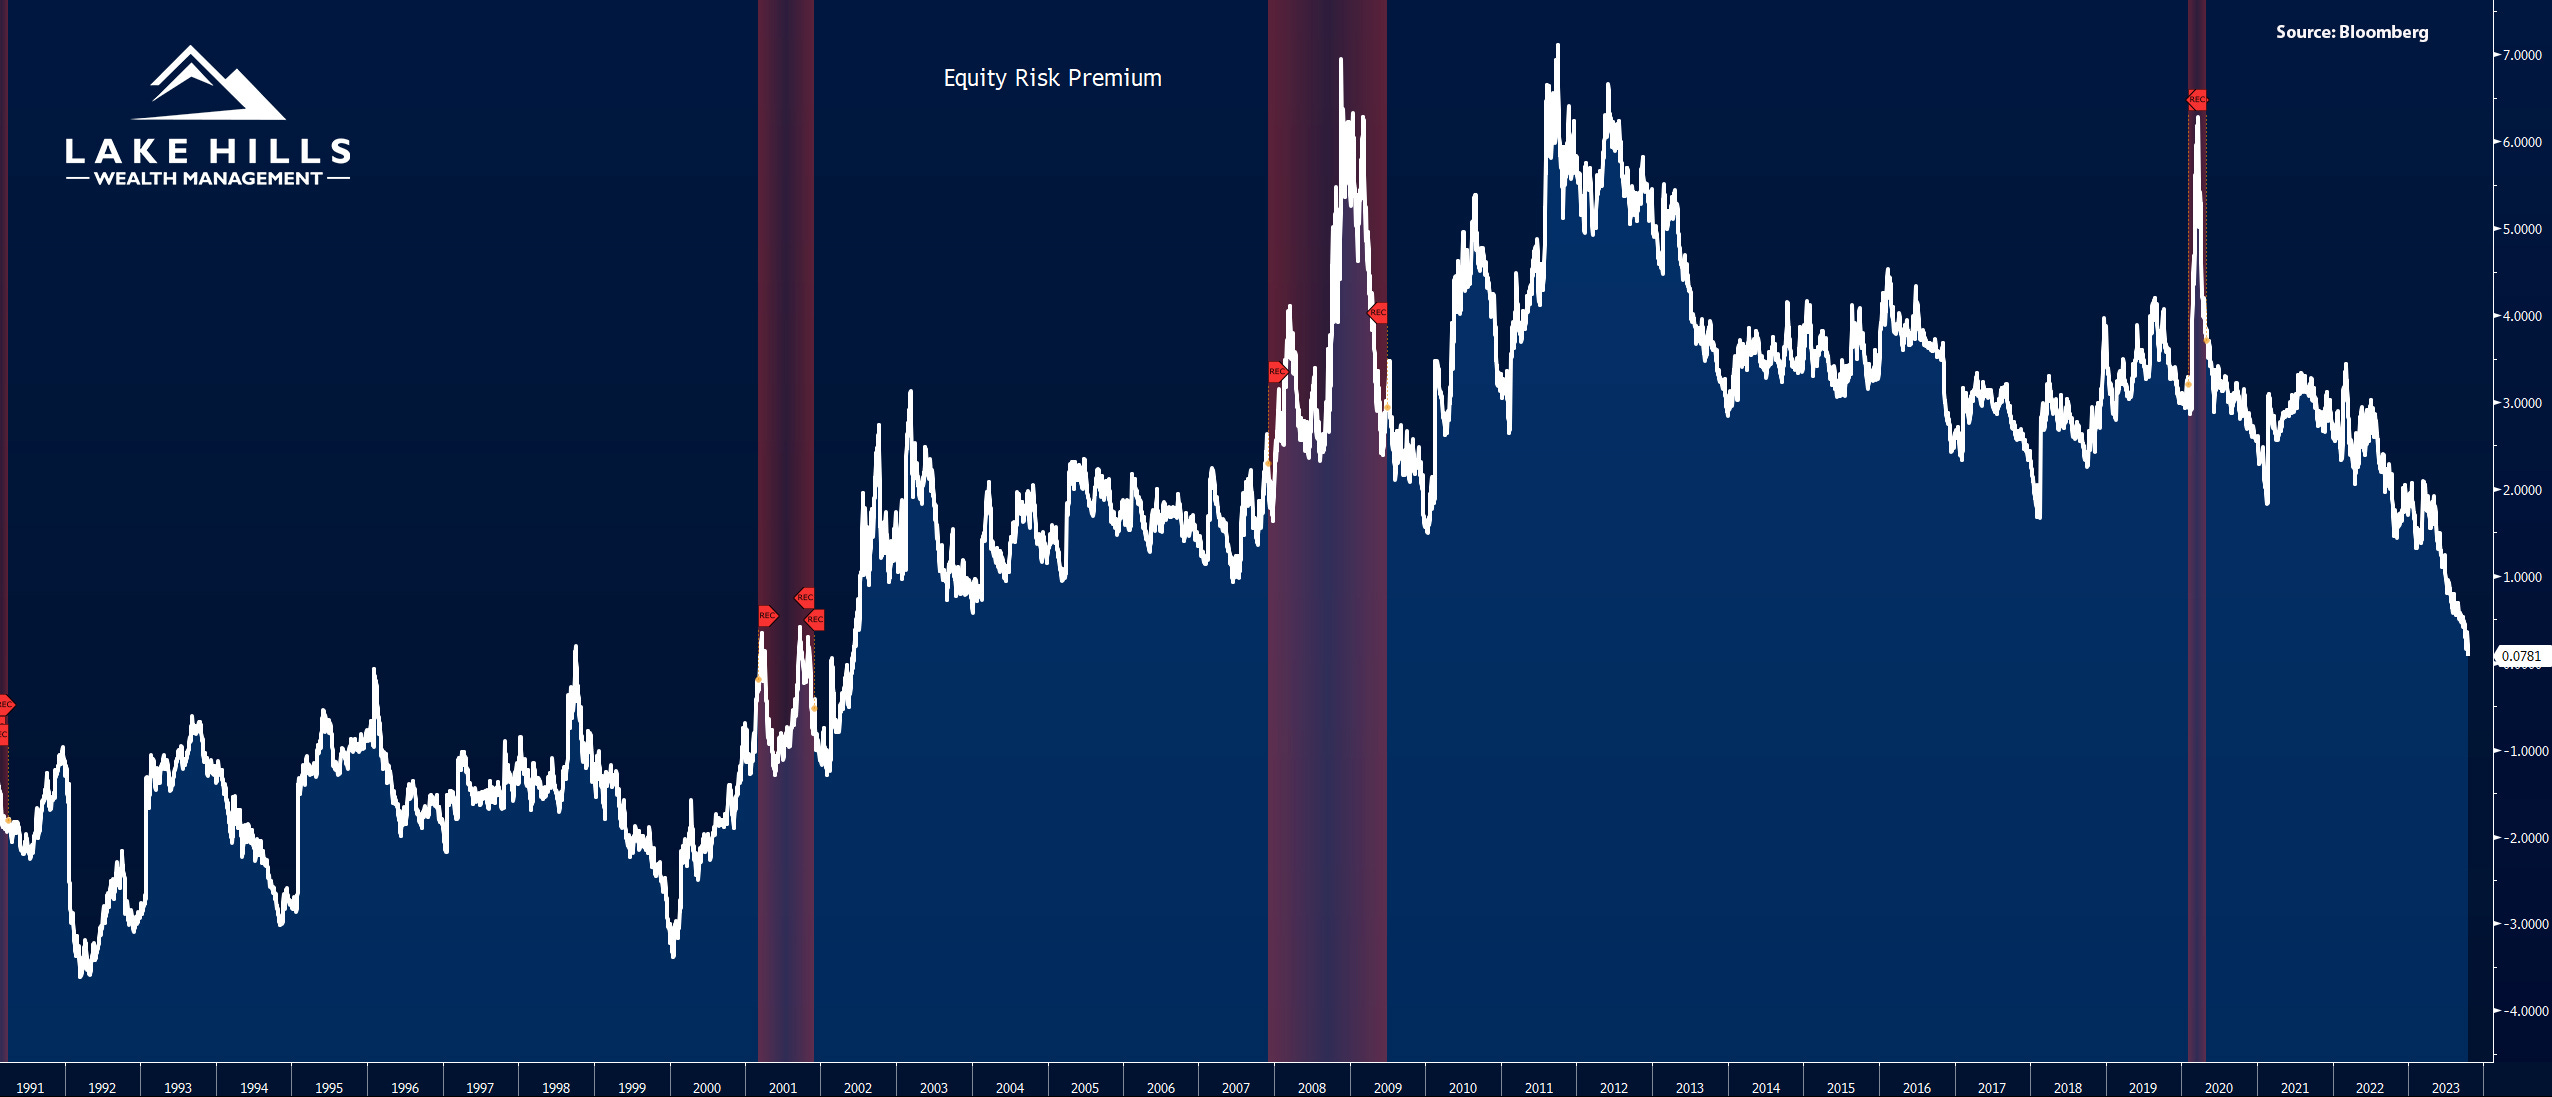
Source: Bloomberg
Yield Curve – The yield curve compares interest rates over different durations. An inversion of the yield curve is when short-term rates are higher than long-term rates. This condition is usually present when the FED hikes short-term rates in an attempt to slow the economy. Meanwhile, market forces move the longer-term rates lower when participants believe inflation and economic growth are set to decline. These short-term elevated interest rates are intended to cool off demand, reduce liquidity, and slow the economy. More times than not, an inverted yield curve often precedes a recession within a timeframe of 12-18 months on average. Currently, the 2-year vs the 10-year has been inverted for about 15 months, so historically speaking, we are entering the danger zone. In the past, seeing the yield curve re-steepen above zero meant the recession was imminent…so you can bet we’ll be watching this carefully.

Source: Bloomberg
Performance Since Start of Bear Market – The following chart compares the total return of the S&P 500, 1-3 month T-Bills (ultra short-term treasuries), 20+ Year Treasuries, the Nasdaq 100, and the Bloomberg Aggregate Bond Index going back to the start of the bear market (January 1, 2022, to October 10, 2023). It is notable to point out that only one of these asset classes is profitable over this period…T-Bills. Although no one can be certain about future outcomes, we wanted to illustrate the fact that the stock market has gone nowhere for two years. So far, the turtle is winning the race, but we realize the race isn’t over. According to our work, the highest probability remains a U.S. recession, which historically should continue to favor a low-risk portfolio. Thus, short-term treasuries have remained our largest portfolio weighting.
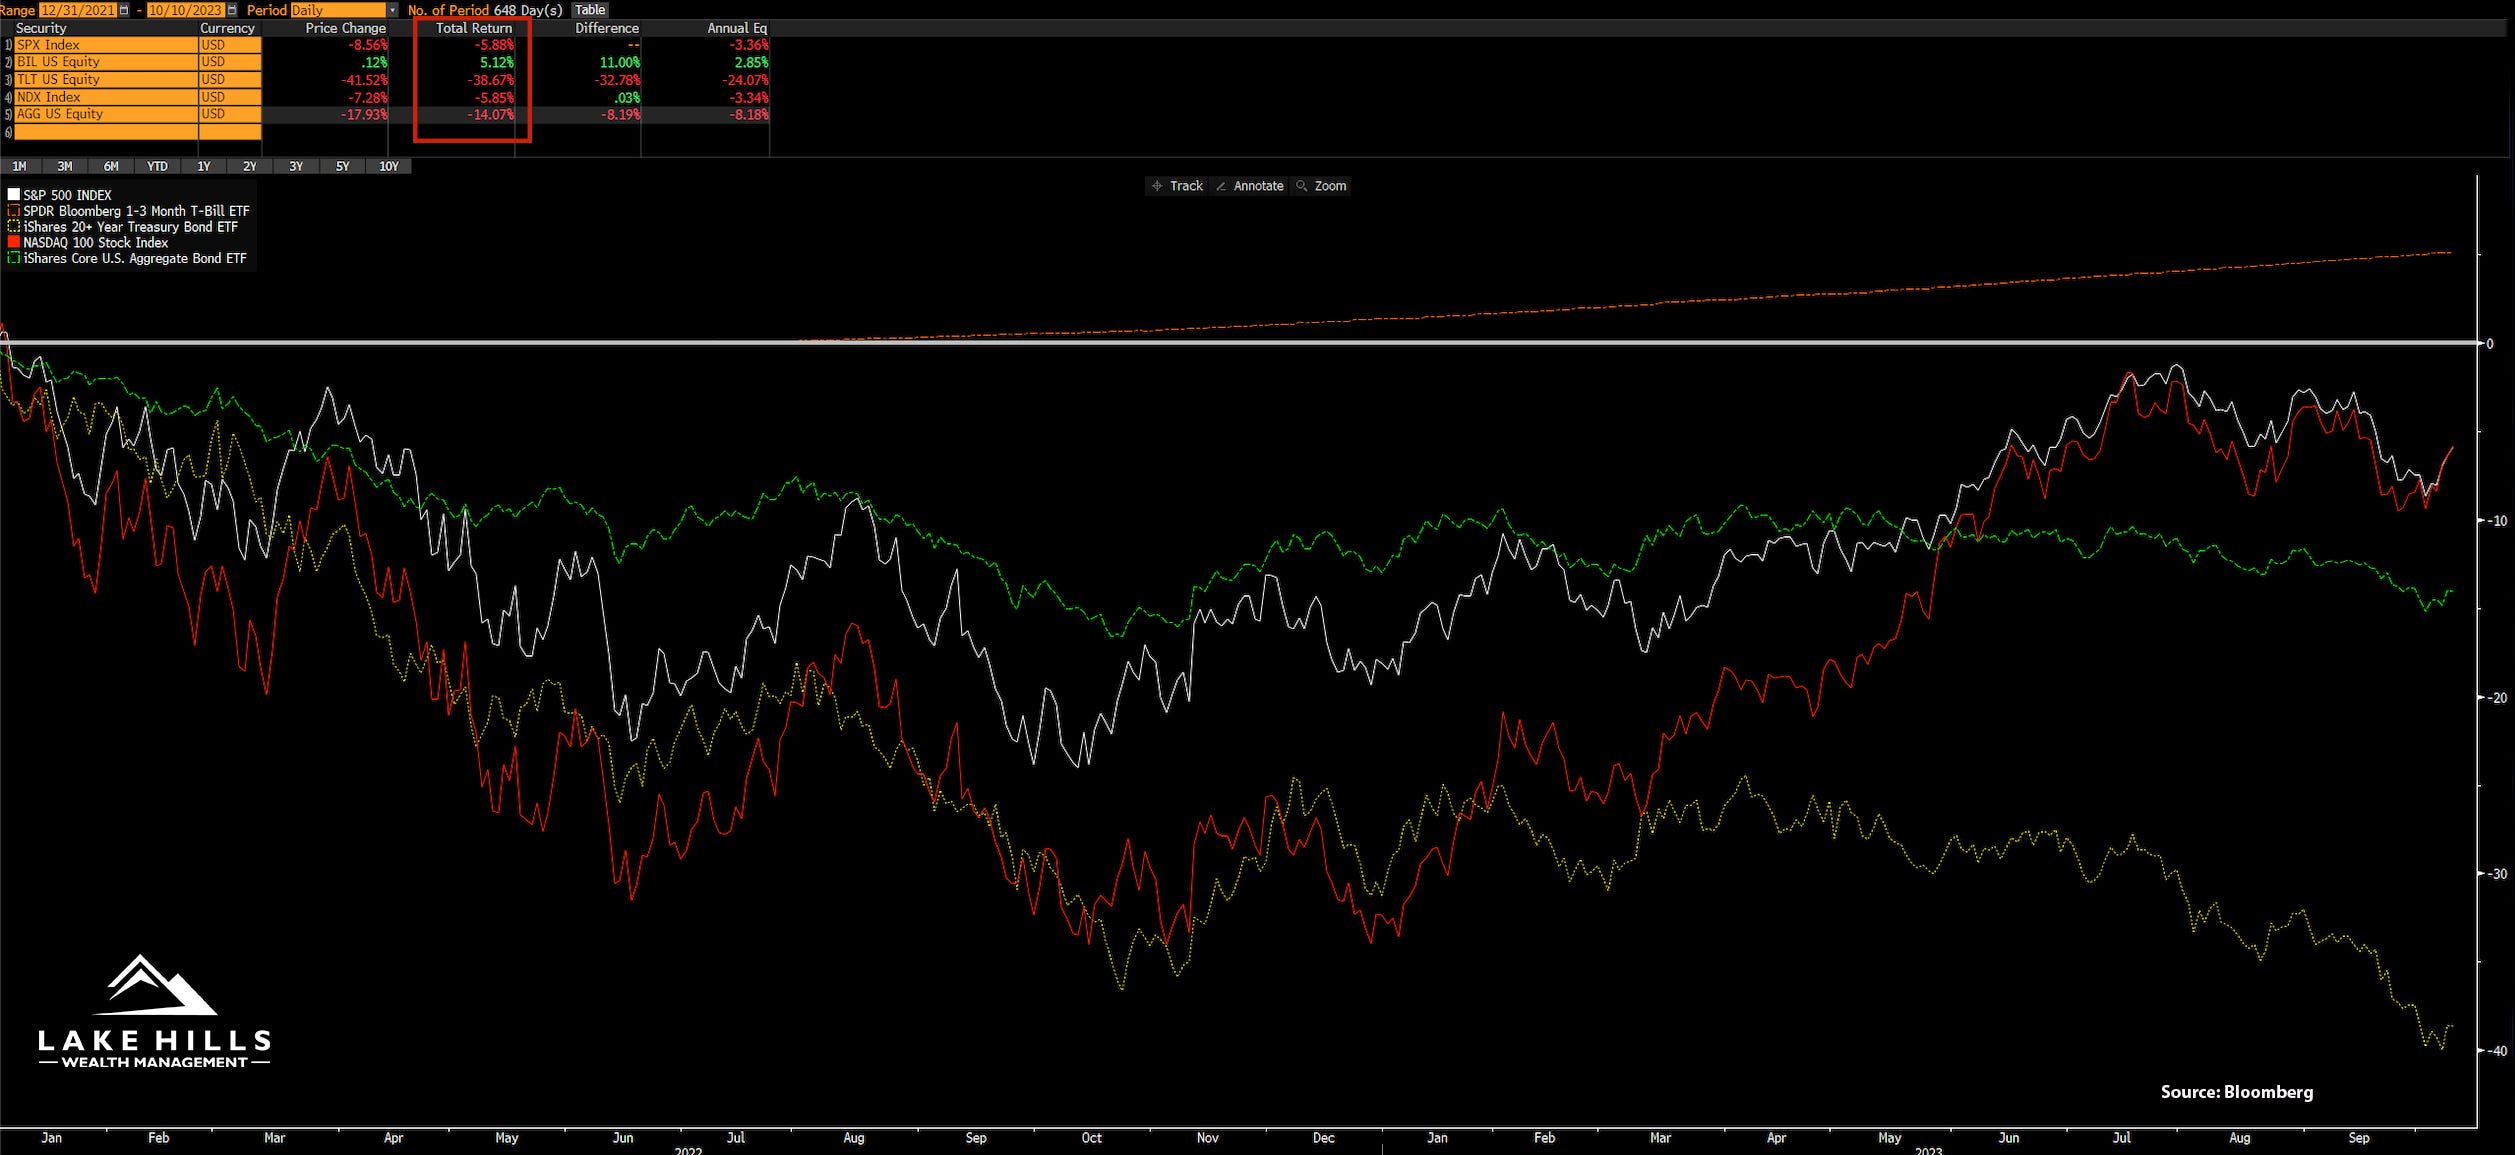
Source: Bloomberg
Our goal is to help you grow your wealth over time while managing the risk of significant drawdowns along the way. Markets never go in a straight line. As we remain defensive, awaiting indication from our technical and economic signals for the time to get bullish, patience is needed to ride out the storm. We remain vigilant in navigating these uncertain markets and searching for the start of the next meaningful uptrend. During the course of our relationship, we have worked with you to establish a portfolio that matches your financial planning needs, risk tolerance, and investment timeline. It is critical to remain patiently invested in the appropriate model. Stick to the plan!
Please do not hesitate to contact us with any questions, comments, or to schedule a portfolio review.
Sincerely,
Lake Hills Wealth Management