

TINA is now TANYA

Key Take Away
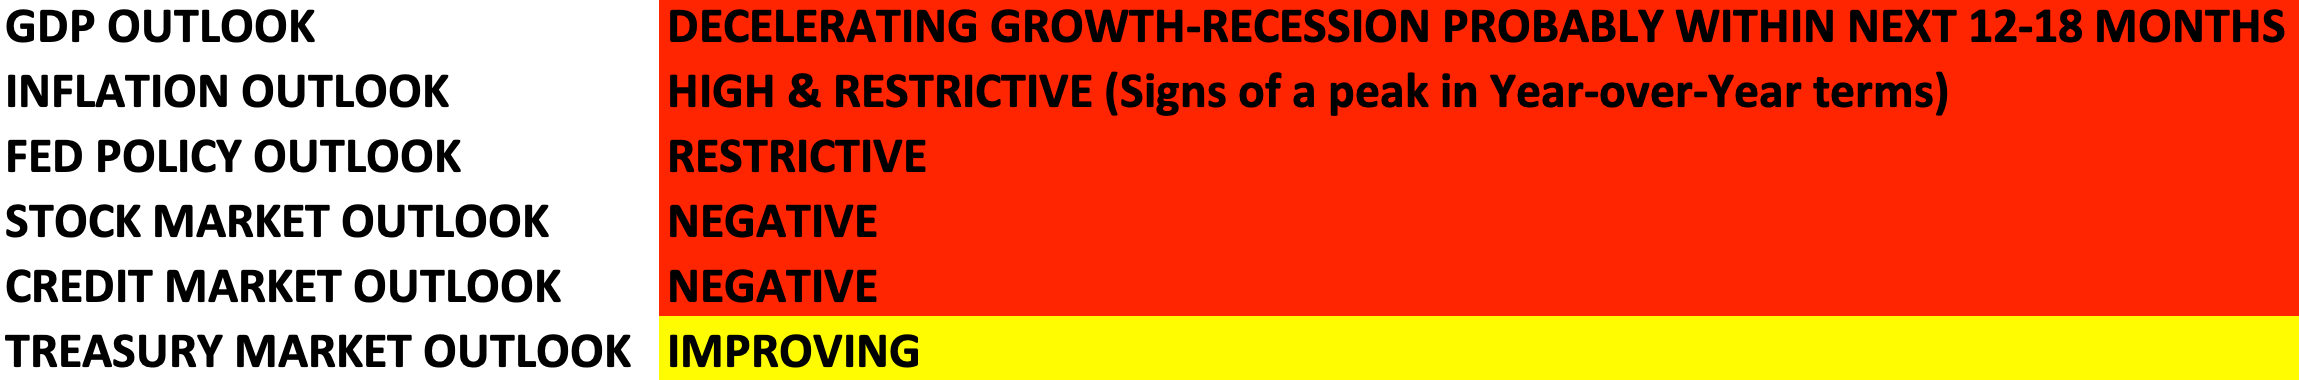
The volatility continues. October was a positive month for U.S. stock indices, with the Dow having its best month since 1976. What’s interesting is this rally occurred despite awful earnings reports from some of the mega-caps (Microsoft, Amazon, Facebook, & Google). Investors continue to hope for a “pivot” from the Fed that leads to a potential soft landing (lower inflation w/o a recession) for the economy. Without the hope of a pivot, there really hasn’t been much reason for the market to rally from an earnings or economic standpoint. With the FED steadfastly raising rates to fight inflation, the economy should continue to slow. While outlook for the stocks has soured this year, there are some opportunities in bonds to navigate this market. Source: Bloomberg
As we patiently wait for this bear market to run its course, short-term treasury notes have become a rather attractive investment opportunity. The Fed has been diligently raising interest rates since March, as a result, short-term treasury notes are now offering a reasonable (in our view) risk-free return as an alternative to stocks. Newly purchased treasury notes with a 12-month maturity now have a yield to maturity of 4.75%. These are liquid securities that can easily be sold if other opportunities arise. We’ve been increasing LHWM portfolio holdings in these short-term treasuries to strengthen our defensive positioning with the goal of enhancing returns in the coming months.
We continue to monitor markets, and the economy, as we seek to protect and grow your nest egg for the future. The buying opportunity we seek in stocks has not yet arrived; thus, LHWM models have remained very defensive since mid-February.
U.S. Outlook
Overview
Back in 2020 and 2021, the FED was holding interest rates near zero while buying $120 billion per month of treasury/mortgage-backed bonds. The result of this policy was that it forced anyone seeking a return on investment of greater than zero to allocate a larger percentage of capital to stocks, real estate, and even cryptocurrencies. Return-seeking investors were forced to take on more risk, and as a result, risk markets went higher. The acronym T.I.N.A. (There Is No Alternative) became quite popular as it referred to there being no alternative to investing in stocks. Things have definitely changed. Source: Bloomberg
Short-term treasury bonds have become an attractive alternative to stocks for the time being. As stocks reached nosebleed valuation levels near the end of 2021, the FED began mulling the need to start raising interest rates in an effort to tame inflation. Now, in November of 2022, the yield on a 1-year Treasury note is at 4.75%. This is up from about 0.15% in November of 2021…a significant increase. While the process of getting to this point has been painful, we now have a safe, conservative place to invest part of the portfolio as we wait for better investment opportunities in stocks. Using these 1-year treasury notes, we’ve been building a bond ladder with maturities spaced out a month apart. As rates have continued to climb, we have added additional tranches to our ladder. The advantage of the ladder is we spread out the maturities, which increases liquidity, and it allows us to average into the note positions as interest rates change. Source: Bloomberg
Now that stocks have come down a significant amount this year, why do we still believe these short-term treasury notes are an attractive alternative to stocks? It has to do with the low and falling risk premium. Equity Risk Premium is a measure of expected return in stocks (the S&P 500 in this case) above what can be earned in a risk-free investment (treasuries). We calculate the expected return for the S&P 500 by taking the consensus forward earnings estimates for the S&P 500 of $230 (currently) and dividing them by the current price of the S&P 500 (3,949 at the time of this writing) to get an earnings yield of 5.8%. Then we use the current yield of a 2-year treasury note (as our risk-free rate) and subtract that from the forward S&P 500 earnings yield to find the equity risk premium. As it currently stands, the equity risk premium for the S&P 500 is a paltry 1.26% compared to the 15-year average of 5.6%. So the expected reward for the risk of investing in the S&P 500 is currently 1.26% higher than what can be earned in a risk-free treasury note. If the forward consensus earnings estimates turn out to be too optimistic (which we believe they are), then the current equity risk premium for the S&P 500 might actually be closer to zero, if not negative. Metrics like this cannot be exclusively relied upon to determine the near-term direction of the market; however, it does give us an idea of the return potential over time. Source: Bloomberg
With that said, short-term treasury notes yielding 4.75% appear to be a better alternative to stocks. We believe TANYA (There Are Now Yield Alternatives) has now replaced TINA (There Is No Alternative) as investors finally have an alternative to stocks. Ha!
Model Positioning
LHWM model portfolios remain defensive. As discussed above, short-term treasury notes offer an attractive yield. We have increased allocation to these notes to 20% in most LHWM model portfolios. With additional FED rate hikes in the queue, we’ll likely continue adding to these individual treasury note holdings. We remain on the sideline with regard to long-term treasury bonds (10-30yr maturities), as inflation has been a bigger concern for market participants than a potential U.S. recession, although that may change soon. The small amount of stock exposure in all models focuses on defensive sectors and energy. We continue to hold short positions to hedge the risk, although we have taken profits to marginally reduce short exposures as we see the potential for a yearend bear market bounce. Market risk remains elevated, so we have continued to keep risk exposure limited.
Keys to the Market
Equity Risk Premium – This is a measure of expected returns for stocks (the S&P 500 in this case) above what can be earned in a risk-free investment (treasuries). We have calculated the earnings yield for the S&P 500 by taking the consensus forward earnings estimates ($230) for the S&P 500 and dividing them by the current price of the S&P 500. Then we subtract the risk-free rate (the current yield of a 2-year treasury note is about 4.55%) from the S&P 500 earnings yield to find the equity risk premium. The equity risk premium for the S&P 500 is currently 1.26%...very low when compared to the 15-year average of 5.6%. Looking at the following chart, notice that recessions often follow periods where the equity risk premium declines. Then the equity risk premium starts to go up as stock prices come down relative to future expected earnings potential whiles risk-free rates decline.

*Red shaded areas indicate NBER-defined U.S. Recession
Forward EPS vs. PMI – Forward earnings estimates have started to decline in 2022, as can be seen in the top half of the chart below. Meanwhile, the stock market has declined sharply this year. Much of this year’s market decline can be attributed to a historic rapid rise in interest rates causing stock valuations to reprice lower, overall earnings haven’t significantly rolled over at this point. The bottom half of the chart shows PMI (Purchasing Managers Index), which illustrates the manufacturing outlook for the economy; this is a leading economic indicator (it leads the economy expansion/contraction). PMI is a diffusion index when it is above 50, it indicates economic expansion when it is below 50, it indicates economic contraction. PMI has been rapidly declining all year and is now nearing contraction territory as it currently stands at 50.2. If we enter a recession, it would lead to a more dramatic earnings decline. A recessionary decline in earnings is not currently priced into stocks as earnings expectations remain very elevated. Shaded red areas are official U.S. recessions.
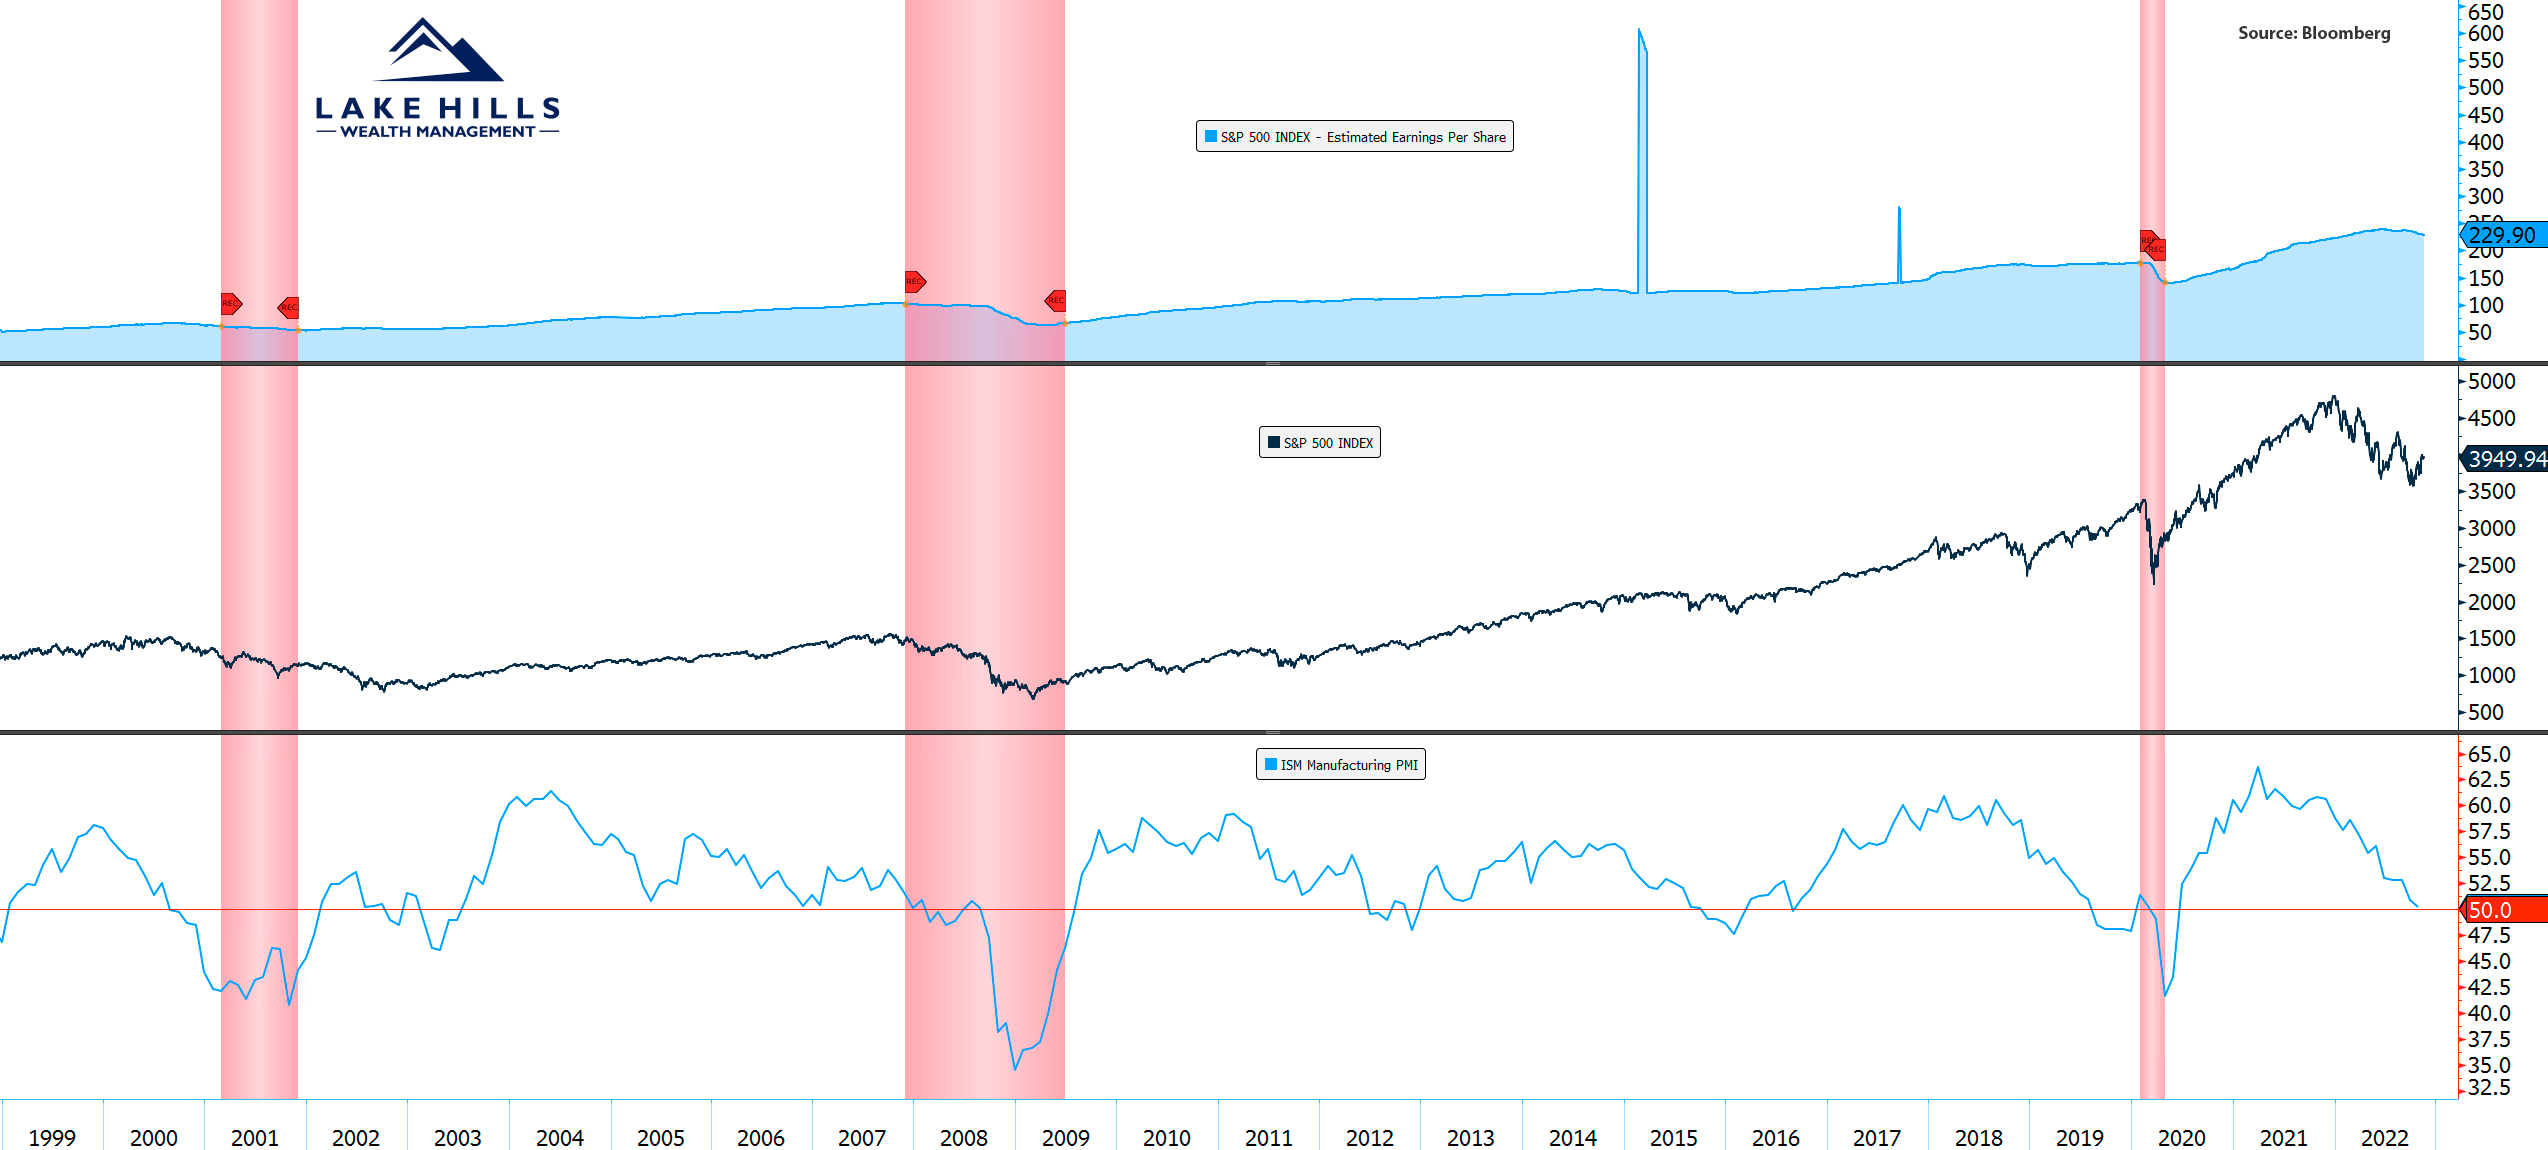
*Red shaded areas indicate NBER-defined U.S. Recession
LEI (Leading Economic Indicator) Index – The LEI Index is a composite of leading economic indicators that include consumer confidence, purchasing managers index, jobless claims, and average hours worked. This index gives an overall view of what the top leading indicators are forecasting. Anytime in the past that we have seen six consecutive months of negative LEI readings, it has led to recession. As reflected in the chart below, we have now printed eight consecutive months of negative LEI readings, which doesn’t bode well for the U.S. economy or risk assets.
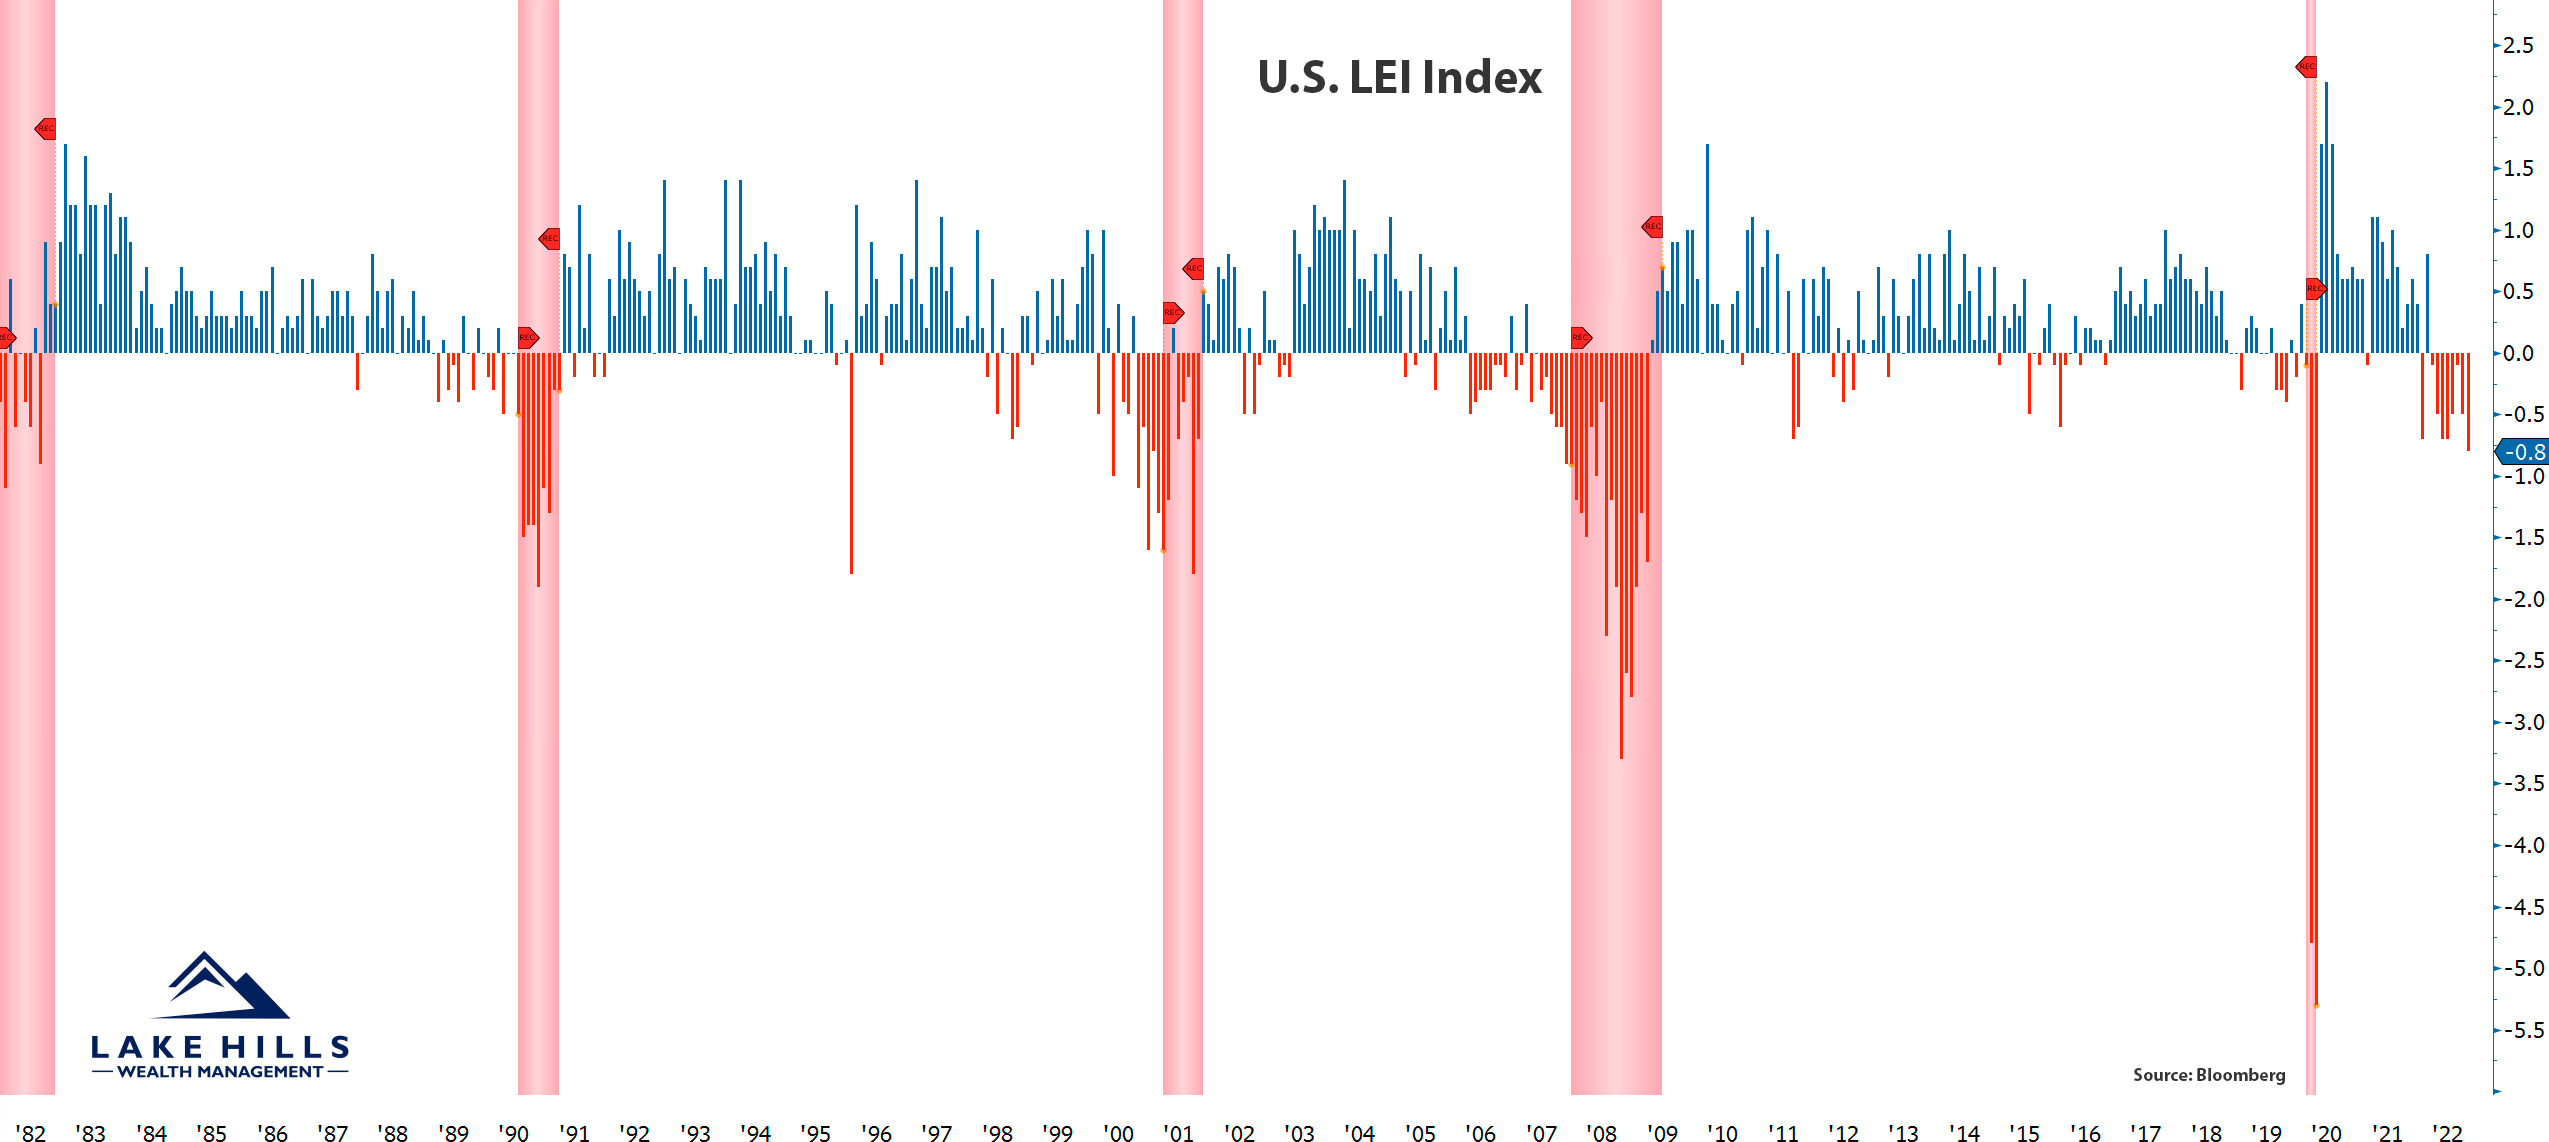
*Red shaded areas indicate NBER-defined U.S. Recession
Remember, patience is key; bear markets and recessions take time to unfold. Just as prices falling hurts portfolios, time dealing with the stress and volatility of the market ultimately wears down investors. Fortunately, we’ve been extremely defensive since February, thereby minimizing the impacts of falling prices and preserving mental capital by not riding the volatility rollercoaster. This downturn will bring great opportunities for investment. We remain conservatively positioned and vigilant in navigating these uncertain markets. During the course of our relationship, we have worked with you to establish a portfolio that matches your financial planning needs, risk tolerance, and investment timeline. With that said, it’s critical to remain patiently invested in the appropriate model and stick to the plan.
Please do not hesitate to contact us with any questions, comments, or to schedule a portfolio review.
Sincerely,
Lake Hills Wealth Management