

Under Pressure

Key Take Away
High-interest rates continue to apply a slowing pressure on the economy, as seen with the recent failures of Silicon Valley Bank, Signature Bank, and Credit Suisse. The Fed’s monetary policy has a lagged effect on the economy. This lag is beginning to catch up.
The recent bout of high inflation followed by the subsequent Fed-induced contraction of money supply, tight bank lending standards, and higher financing costs is a prelude to recession. In the past, these developments have caused corporate profits to shrink, stock prices to drop, and ultimately increased unemployment (recession).
The probability of recession remains high. Due to this, LHWM models remain very defensive.
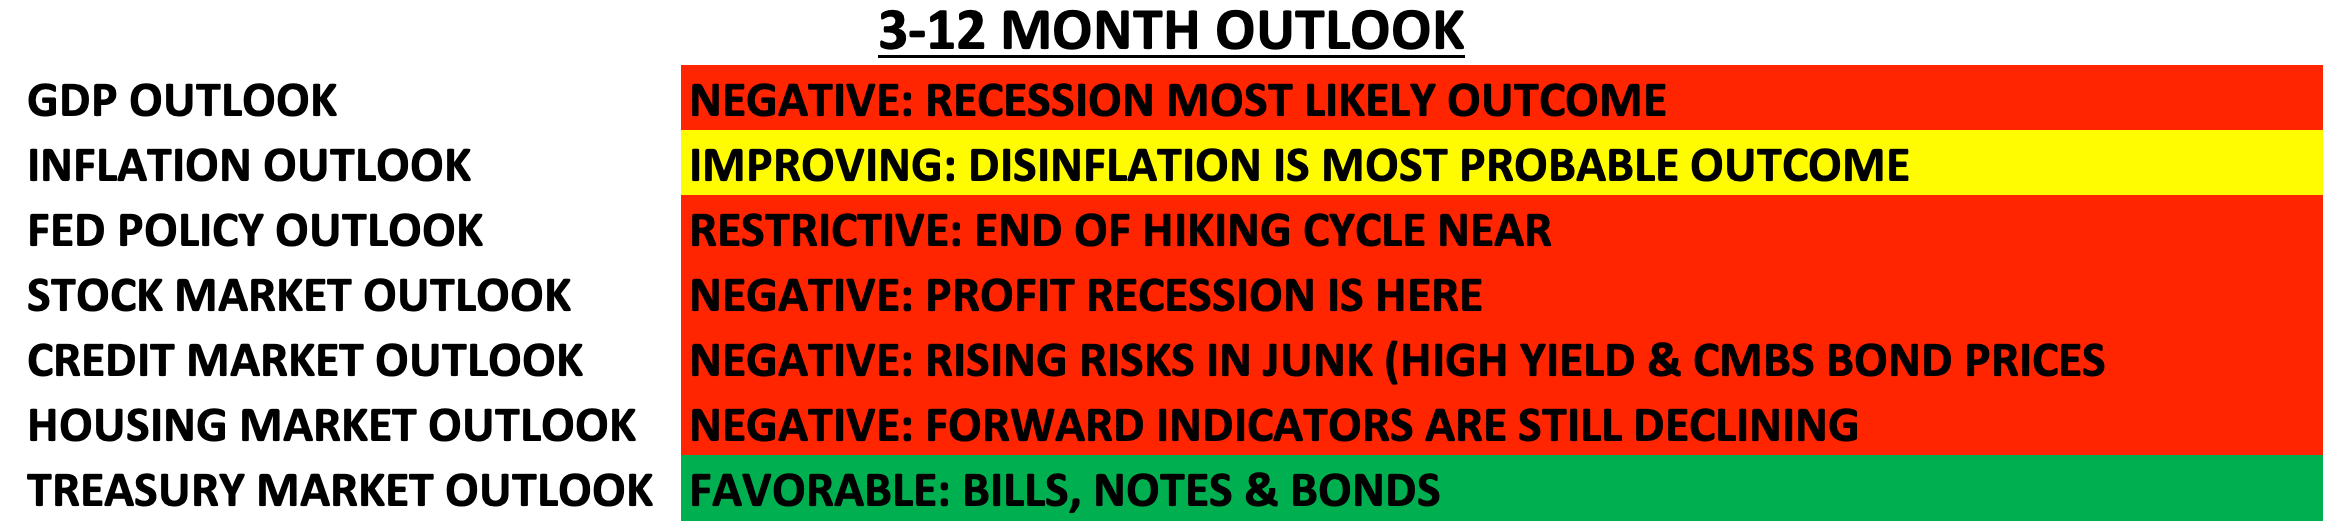
U.S. Outlook (Next 3-12 Months)
Overview
Imagine an old dam holding back water in a lake. The dam works fine under normal conditions when water levels are low or moderate. However, when floods come, and water levels rise, pressure builds. This mounting pressure exposes structural weaknesses in the old dam. If the water pressure is not managed effectively, cracks and leaks begin to show, and ultimately the dam breaks.
High-interest rates are the unrelenting water pressure on the U.S. economy right now. Recently some new cracks have been exposed in the banking sector as a direct result of the rapidly increased interest rates over the past year. The second (Silicon Valley Bank) and third (Signature Bank) largest bank failures in U.S. history just unraveled. (Source: Bloomberg)
The rapid swings in interest rates (record lows to record highs within two years) created significant losses for bonds that most banks hold on their balance sheet (same as the Fed balance sheet). These bonds are high-quality U.S. Treasury securities and/or agency debt, such as mortgage bonds that have a paper loss now but normally don’t pose a problem for the banks. Holding these bonds to maturity ensures the bank’s investment is fully returned. The problem with Silicon Valley Bank was once the bank run started (easy to move money via the web), these banks were forced to liquidate their bonds at significant losses as they needed to raise cash to return to depositors. The bank run ultimately caused the failure of SVB bank, as no bank can survive a bank run given the design of a fractional banking system. This crisis raised awareness around the second issue, bank deposit rates versus T-Bill and money market rates. The rapid rate hiking cycle by the Fed created a safe and high-yielding alternative for depositors to park cash, i.e., T-Bills and/or Money Market accounts. When the bank runs started, depositors moved balances to the large Global Systemically Important Banks (GSIBs) and money market funds. (Source: Bloomberg)
While bank failures are unnerving, they are not new. With over 4,300 banks in the U.S., it is common for poorly run banks to fail; you don’t hear about them. There are procedures to deal with failed banks and help depositors get their money, especially within FDIC limits. In this case, the government stepped in to ensure all depositors were made whole. Additionally, the FED has established new liquidity facilities so banks have access to additional capital without selling bonds at a loss. While the FED and FDIC work to prevent additional banks from failing under the same circumstances, financial issues remain. We believe bank profitability will be under pressure as they try stabilizing customer deposits and balance sheets while potentially being subject to more regulation. It is not easy or painless to transition from a low-interest-rate world to a high one. (Source: Bloomberg & FDIC)
What will be the longer-term implication of this most recent banking crisis? One potentially important issue is that lending standards are likely to tighten further. Small and regional banks account for significant lending and credit creation in the U.S. (estimates show as high as 50%). When banks tighten lending standards, they decrease lending activity as fewer loan applications will satisfy their higher standards. Slower lending is a negative for the economy. In our February market outlook, we highlighted that bank lending standards had already begun tightening, a sign that banks were bracing for stress. To further pressure the situation, there has been a massive deposit exodus from these smaller banks due to worries about their viability and the ability to get higher yields on cash elsewhere. The public has finally realized they can earn more on their cash in short-term treasuries and money market funds than in their savings and checking accounts. A shrinking deposit base also means less available funds to be lent. (Source: Bloomberg & FED)
When banks make fewer loans, it results in less economic activity. We believe this will add further slowing pressure to an already slowing economy. This recent episode of bank failures serves as a reminder of why we have been, and remain, so defensive with portfolio allocations. Even though the stock market hasn’t received the memo, a recession is likely very near, and caution should be maintained.
Model Positioning
In addition to the negative trend for corporate earnings, central banks around the globe continue to drain liquidity from the system. We believe short-term treasury bills and notes remain an attractive place to park capital in the short term while we await a better, lower entry point for stock exposure. Additionally, we have added some longer-duration Treasury bonds back to the portfolio allocation as rates typically decline during recessions as the growth and inflation decline. The small percentage of stock exposure in all models focuses on defensive sectors, value over growth, and high dividends. Stock valuations are still unattractive versus bonds at this juncture, and stocks aren’t pricing what is likely to be an economic and earnings recession.
We expect the market to remain volatile in 2023. To navigate this volatility, we will adjust exposures (long and short) based on our macroeconomic and market indicators to reduce portfolio volatility and protect capital. Market risk remains elevated, and we remain cautious.
Keys to the Market
Money Supply vs. GDP – Money supply is important in determining the economy's future growth as well as the path of the stock market. M2 Money Supply measures the aggregate currency held in cash, banks, money markets, savings deposits, etc. Over the last 60 years, there has been a high correlation between M2 Money Supply and the stock market. While the timing of the correlation has changed over time, if we dial in on the last 20 years, changes in M2 money Supply have led the stock market by about 12 months. The following chart illustrates the level of M2 Money Supply relative to U.S. GDP with the red line and has been moved forward 12 months to enhance the leading correlation visually. Notice the FED’s aggressive response to Covid in 2020 resulted in a massive increase in M2 Money supply relative to GDP, and a massive rally followed. Prior surges in the money supply also resulted in gains for the S&P 500. However, recently with the FED hiking rates and tightening policy, we have seen one of the fast contractions in M2 money supply relative to GDP since the 1930s. With the red line being moved forward 12 months, it illustrates that directional pressure for the stock market is negative for the next 6 to 12 months from a liquidity standpoint. Don’t fight the FED. (Source: Bloomberg & FED)

Inflation vs. Unemployment – Rising inflation has a high leading correlation to unemployment. The following chart compares the 12-month rate of change of CPI (consumer price inflation) to the US unemployment rate. Over the last 50 years, increases in the rate of change of CPI have led to increases in unemployment by about two years… So, the chart below has moved the CPI line forward by two years to illustrate this leading correlation directly and indicate where unemployment might be headed. Interestingly, layoffs have been picking up steam over the last six months.

Treasury Yield Spread vs. Corporate Profits – For the better part of the last year, the yield curve for U.S. treasuries has been inverted (long-term rates lower than short-term rates). The chart below illustrates the inversion of the 10-year yield versus the 3-month yield (the white line). This pair is inverted when this line goes below 0 (left column). The yield inversion of this pair has been a good predictor of recessions in the past. Thus, there is a high correlation to corporate profits. This chart illustrates corporate profits as a percent of GDP (green line). Compression and inversion of the yield curve have preceded profit contractions by about 15 months on average. Thus, the white line has been moved forward by 15 months to illustrate the predictive correlation better. Notice in the past, when the yield spread has fallen sharply, it has preceded sharp declines in corporate profits. We are soon arriving at the point in time where corporate profits should start dropping sharply if this correlation is to continue.

Markets never go in a straight line. As we remain defensive, awaiting indication from our technical and economic signals for the time to get bullish, patience is needed to ride out the storm. We remain vigilant in navigating these uncertain markets and searching for the start of the next uptrend in the stock market. During the course of our relationship, we have worked with you to establish a portfolio that matches your financial planning needs, risk tolerance, and investment timeline. It is critical to remain patiently invested in the appropriate model. Stick to the plan and don’t get triggered during what we believe is a non-fundamental bout of euphoria in the stock market.
Please do not hesitate to contact us with any questions, comments, or to schedule a portfolio review.
Sincerely,
Lake Hills Wealth Management